This function uses geom_sf(), unless overridden by the geom argument.
Requires the ggplot2 package.
Usage
# S3 method for class 'sf'
gg(data, mapping = NULL, ..., geom = "sf")
Arguments
- data
An
sfobject.- mapping
Default mapping is
ggplot2::aes(geometry = ...), where the geometry name is obtained fromattr(data, "sf_column"). This is merged with the user supplied mapping.- ...
Arguments passed on to
geom_sforgeom_tile.- geom
Either "sf" (default) or "tile". For "tile", uses
geom_tile(..., stat = "sf_coordinates"), intended for converting point data to grid tiles with thefillaesthetic, which is by default set to the first data column.
See also
Other geomes:
gg(),
gg.RasterLayer(),
gg.SpatRaster(),
gg.Spatial,
gg.data.frame(),
gg.fm_mesh_1d(),
gg.fm_mesh_2d(),
gg.matrix()
Examples
# \donttest{
if (require("ggplot2", quietly = TRUE) &&
bru_safe_terra(quietly = TRUE) &&
require("tidyterra", quietly = TRUE)) {
# Load Gorilla data
gorillas <- inlabru::gorillas_sf
gorillas$gcov <- gorillas_sf_gcov()
# Plot Gorilla elevation covariate provided as terra::rast.
ggplot() +
gg(gorillas$gcov$elevation)
# Add Gorilla survey boundary and nest sightings
ggplot() +
gg(gorillas$gcov$elevation) +
gg(gorillas$boundary, alpha = 0) +
gg(gorillas$nests)
# Load pantropical dolphin data
mexdolphin <- inlabru::mexdolphin_sf
# Plot the pantropical survey boundary, ship transects and dolphin
# sightings
ggplot() +
gg(mexdolphin$ppoly, alpha = 0.5) + # survey boundary
gg(mexdolphin$samplers) + # ship transects
gg(mexdolphin$points) # dolphin sightings
# Change color
ggplot() +
gg(mexdolphin$ppoly, color = "green", alpha = 0.5) + # survey boundary
gg(mexdolphin$samplers, color = "red") + # ship transects
gg(mexdolphin$points, color = "blue") # dolphin sightings
# Visualize data annotations: line width by segment number
names(mexdolphin$samplers) # 'seg' holds the segment number
ggplot() +
gg(mexdolphin$samplers, aes(color = seg))
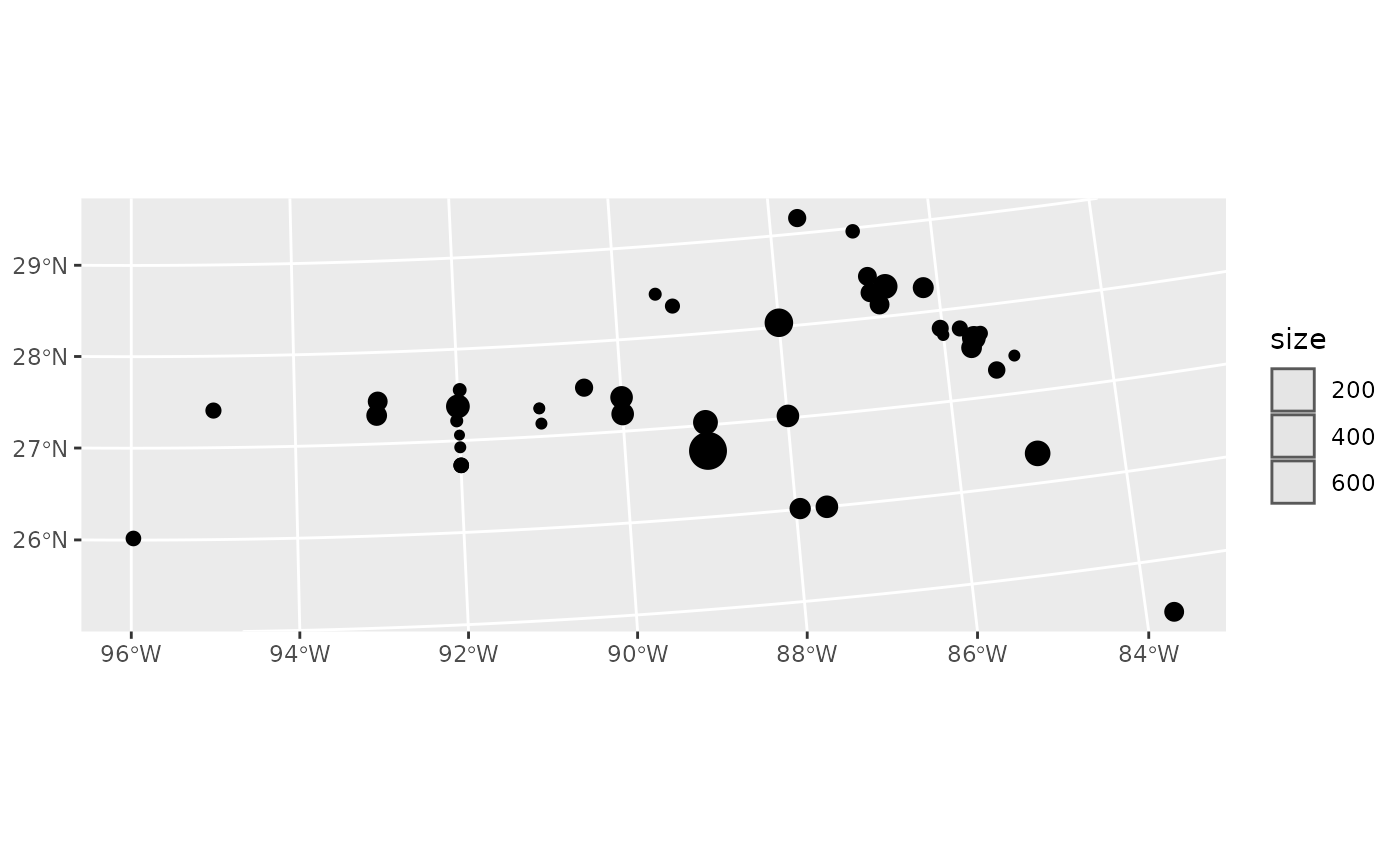
# Visualize data annotations: point size by dolphin group size
names(mexdolphin$points) # 'size' holds the group size
ggplot() +
gg(mexdolphin$points, aes(size = size))
}
 # }
# }