This a version of the mexdolphins dataset from the package
dsm, reformatted as point process data for use with inlabru, with the
parts stored in sf format. The data are from a combination of several
NOAA shipboard surveys conducted on pan-tropical spotted dolphins in the
Gulf of Mexico. 47 observations of groups of dolphins were detected. The
group size was recorded, as well as the Beaufort sea state at the time of
the observation. Transect width is 16 km, i.e. maximal detection distance 8
km (transect half-width 8 km).
Format
A list of objects:
points:An
sfobject containing the locations of detected dolphin groups, with their size as an attribute.samplers:An
sfobject containing the transect lines that were surveyed.mesh:An
fm_mesh_2dobject containing a Delaunay triangulation mesh (a type of discretization of continuous space) covering the survey region.ppoly:An
sfobject defining the boundary of the survey region.simulated:A
sfobject containing the locations of a simulated population of dolphin groups. The population was simulated from ainlabrumodel fitted to the actual survey data. Note that the simulated data do not have any associated size information.
References
Halpin, P.N., A.J. Read, E. Fujioka, B.D. Best, B. Donnelly, L.J. Hazen, C. Kot, K. Urian, E. LaBrecque, A. Dimatteo, J. Cleary, C. Good, L.B. Crowder, and K.D. Hyrenbach. 2009. OBIS-SEAMAP: The world data center for marine mammal, sea bird, and sea turtle distributions. Oceanography 22(2):104-115
NOAA Southeast Fisheries Science Center. 1996. Report of a Cetacean Survey of Oceanic and Selected Continental Shelf Waters of the Northern Gulf of Mexico aboard NOAA Ship Oregon II (Cruise 220)
Examples
# \donttest{
if (require("ggplot2", quietly = TRUE)) {
data(mexdolphin_sf, package = "inlabru", envir = environment())
ggplot() +
gg(mexdolphin_sf$mesh) +
gg(mexdolphin_sf$ppoly, color = "blue", alpha = 0, linewidth = 1) +
gg(mexdolphin_sf$samplers) +
gg(mexdolphin_sf$points, aes(size = size), color = "red") +
scale_size_area()
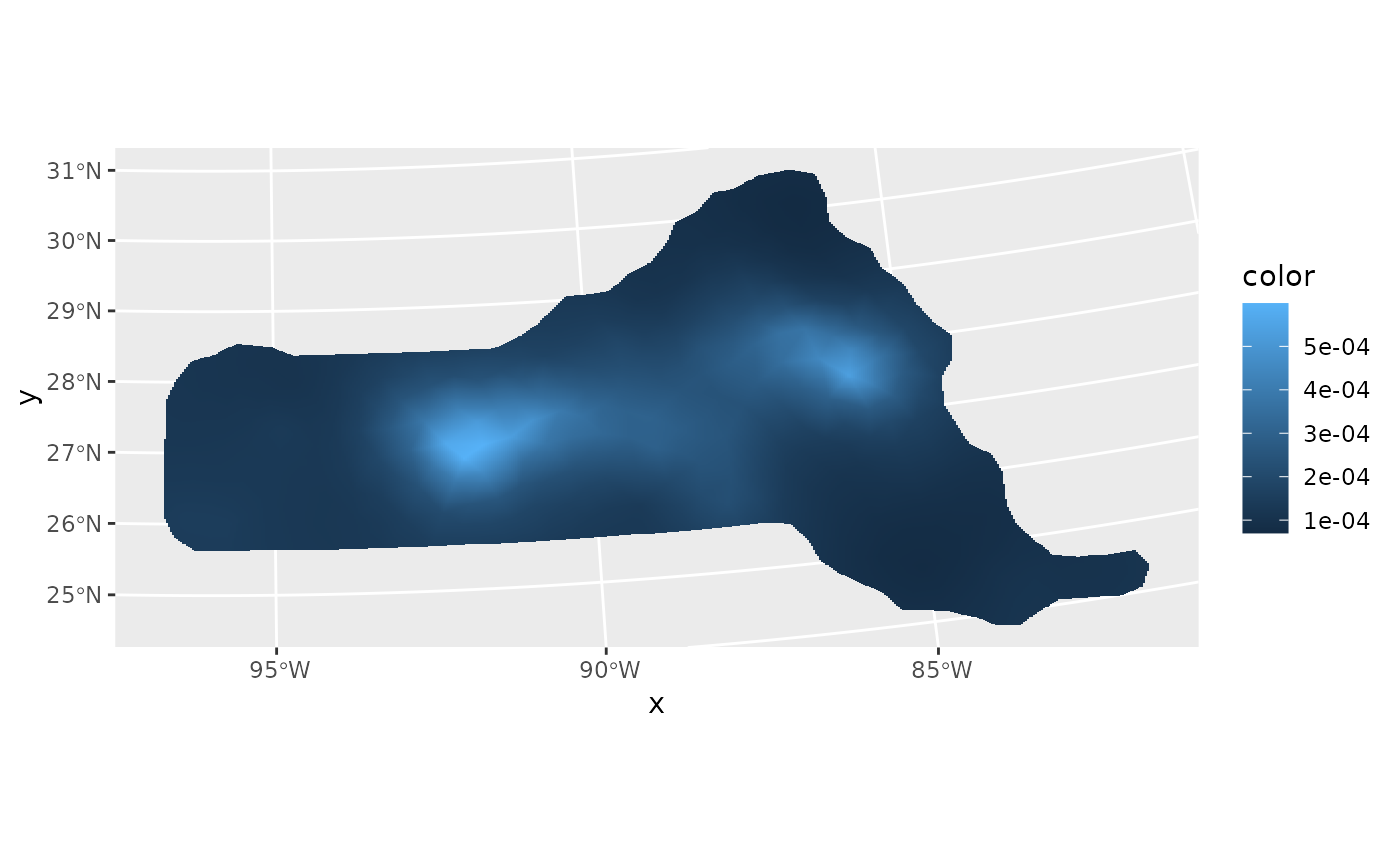
ggplot() +
gg(mexdolphin_sf$mesh,
color = mexdolphin_sf$lambda,
mask = mexdolphin_sf$ppoly
)
}
 # }
# \donttest{
if (require("ggplot2", quietly = TRUE) &&
require("sp", quietly = TRUE)) {
mexdolphin <- mexdolphin_sp()
ggplot() +
gg(mexdolphin$mesh) +
gg(mexdolphin$ppoly, color = "blue") +
gg(mexdolphin$samplers) +
gg(mexdolphin$points, aes(size = size), color = "red") +
scale_size_area() +
coord_equal()
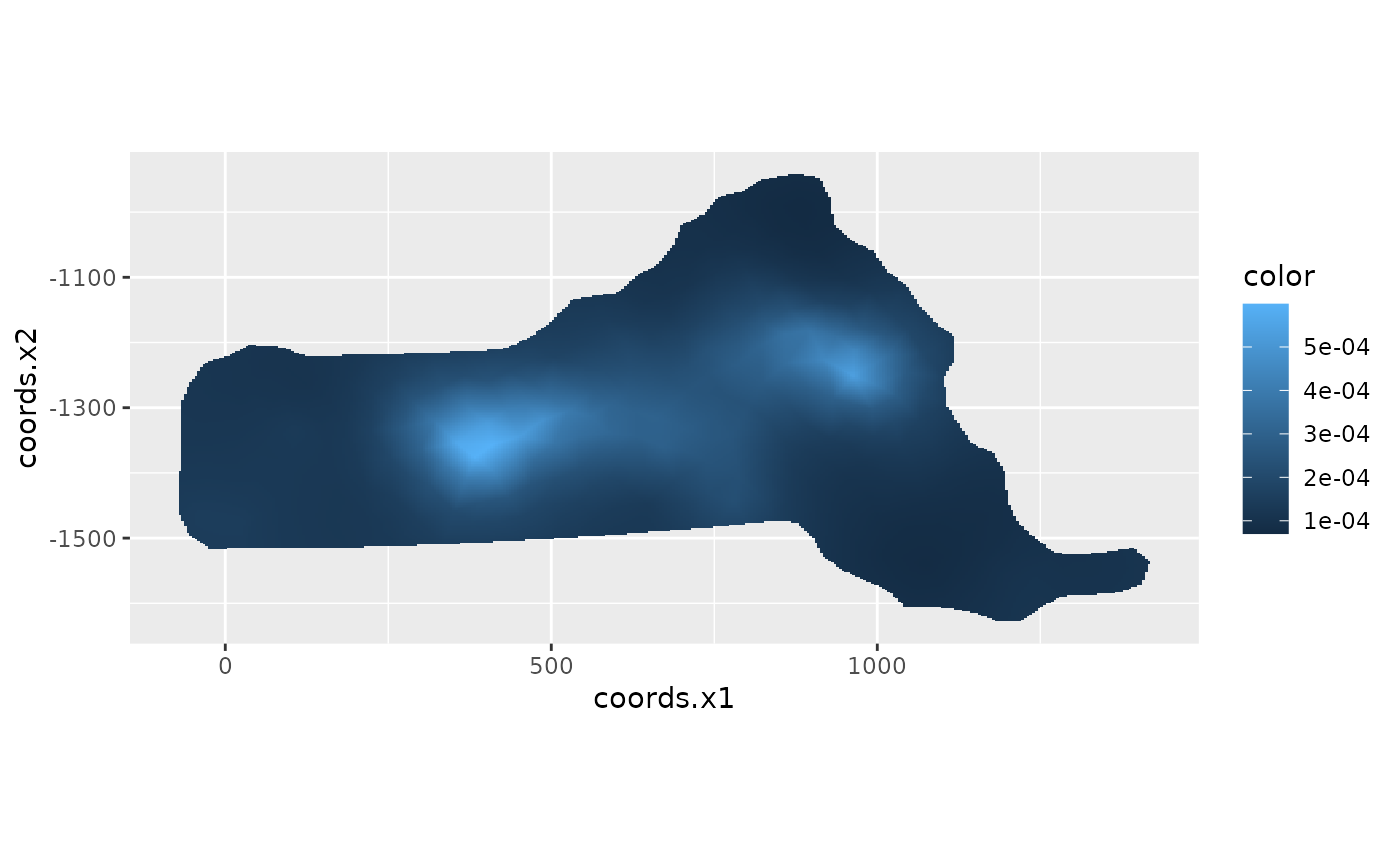
ggplot() +
gg(mexdolphin$mesh,
col = mexdolphin$lambda,
mask = mexdolphin$ppoly
) +
coord_equal()
}
# }
# \donttest{
if (require("ggplot2", quietly = TRUE) &&
require("sp", quietly = TRUE)) {
mexdolphin <- mexdolphin_sp()
ggplot() +
gg(mexdolphin$mesh) +
gg(mexdolphin$ppoly, color = "blue") +
gg(mexdolphin$samplers) +
gg(mexdolphin$points, aes(size = size), color = "red") +
scale_size_area() +
coord_equal()
ggplot() +
gg(mexdolphin$mesh,
col = mexdolphin$lambda,
mask = mexdolphin$ppoly
) +
coord_equal()
}
 # }
# }