Uses the ggplot2::fortify() function to turn the SpatialPolygons objects
into a data.frame. Then calls geom_polygon to plot the polygons. Requires
the ggplot2 package.
Usage
# S3 method for class 'SpatialPolygons'
gg(data, mapping = NULL, crs = NULL, ...)
Arguments
- data
A
SpatialPolygonsorSpatialPolygonsDataFrameobject.- mapping
Aesthetic mappings created by
aesused to update the default mapping.- crs
A
CRSobject defining the coordinate system to project the data to before plotting.- ...
Arguments passed on to
geom_sf. Unless specified by the user, the argumentalpha = 0.2(alpha level for polygon filling) is added.
Details
Up to version 2.10.0, the ggpolypath package was used to ensure
proper plotting, since the ggplot2::geom_polygon function doesn't always
handle geometries with holes properly. After 2.10.0, the object is
converted to sf format and passed on to gg.sf() instead, as ggplot2
version 3.4.4 deprecated the intenrally used ggplot2::fortify() method
for SpatialPolygons/DataFrame objects.
See also
Other geomes for spatial data:
gg(),
gg.SpatRaster(),
gg.SpatialGridDataFrame(),
gg.SpatialLines(),
gg.SpatialPixels(),
gg.SpatialPixelsDataFrame(),
gg.SpatialPoints(),
gg.sf()
Examples
# \donttest{
  if (require("ggplot2", quietly = TRUE) &&
      bru_safe_terra(quietly = TRUE) &&
      bru_safe_sp() &&
      require("sp")) {
    # Load Gorilla data

    gorillas <- inlabru::gorillas_sf

    gcov <- gorillas_sf_gcov()
    elev <- terra::as.data.frame(gcov$elevation, xy = TRUE)
    elev <- sf::as_Spatial(sf::st_as_sf(elev, coords = c("x", "y")))

    # Turn elevation covariate into SpatialGridDataFrame
    elev <- sp::SpatialPixelsDataFrame(elev, data = as.data.frame(elev))

    # Plot Gorilla elevation covariate provided as SpatialPixelsDataFrame.
    # The same syntax applies to SpatialGridDataFrame objects.

    ggplot() +
      gg(elev)

    # Add Gorilla survey boundary and nest sightings

    ggplot() +
      gg(elev) +
      gg(gorillas$boundary, alpha = 0.0, col = "red") +
      gg(gorillas$nests)

    # Load pantropical dolphin data

    mexdolphin <- inlabru::mexdolphin_sp()

    # Plot the pantropical survey boundary, ship transects and dolphin sightings

    ggplot() +
      gg(mexdolphin$ppoly) + # survey boundary as SpatialPolygon
      gg(mexdolphin$samplers) + # ship transects as SpatialLines
      gg(mexdolphin$points) # dolphin sightings as SpatialPoints

    # Change color

    ggplot() +
      gg(mexdolphin$ppoly, color = "green") + # survey boundary; SpatialPolygon
      gg(mexdolphin$samplers, color = "red") + # ship transects; SpatialLines
      gg(mexdolphin$points, color = "blue") # dolphin sightings; SpatialPoints


    # Visualize data annotations: line width by segment number

    names(mexdolphin$samplers) # 'seg' holds the segment number
    ggplot() +
      gg(mexdolphin$samplers, aes(color = seg))

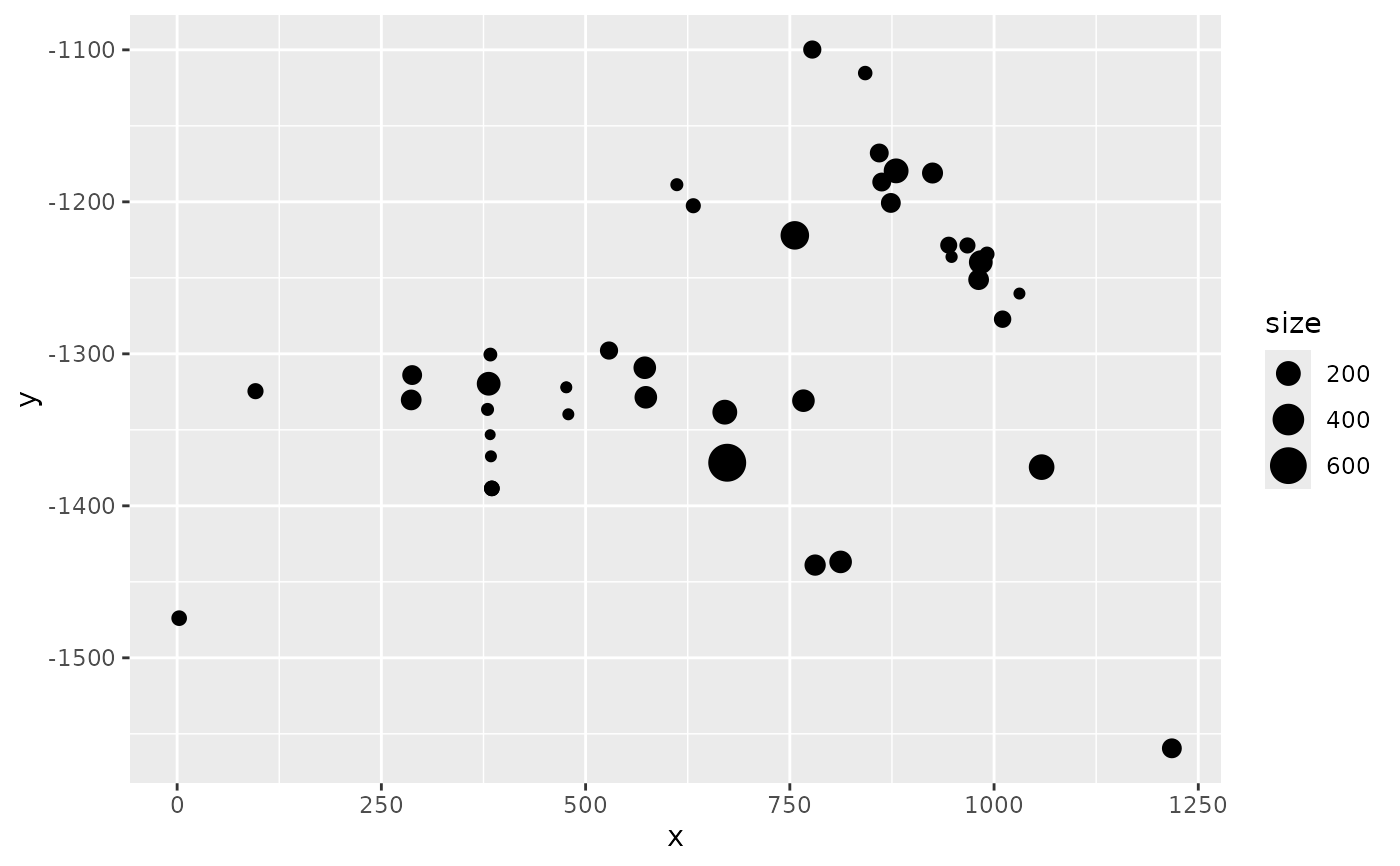
    # Visualize data annotations: point size by dolphin group size

    names(mexdolphin$points) # 'size' holds the group size
    ggplot() +
      gg(mexdolphin$points, aes(size = size))
  }

# }
# }