A line in 2D space is defined by a start and an end point, each associated
with 2D coordinates. This function takes a data.frame as input and assumes
that each row defines a line in space. In order to do so, the data frame must
have at least four columns and the start.cols and end.cols parameters
must be used to point out the names of the columns that define the start and
end coordinates of the line. The data is then converted to a
SpatialLinesDataFrame DF. If a coordinate reference system crs is
provided it is attached to DF. If also to.crs is provided, the coordinate
system of DF is transformed accordingly. Additional columns of the input
data, e.g. covariates, are retained and attached to DF.
Arguments
- data
A data.frame
- start.cols
Character array pointing out the columns of
datathat hold the start points of the lines- end.cols
Character array pointing out the columns of
datathat hold the end points of the lines- crs
Coordinate reference system of the original
data- to.crs
Coordinate reference system for the output.
- format
Format of the output object. Either
"sp"(default) or"sf"
Examples
# \donttest{
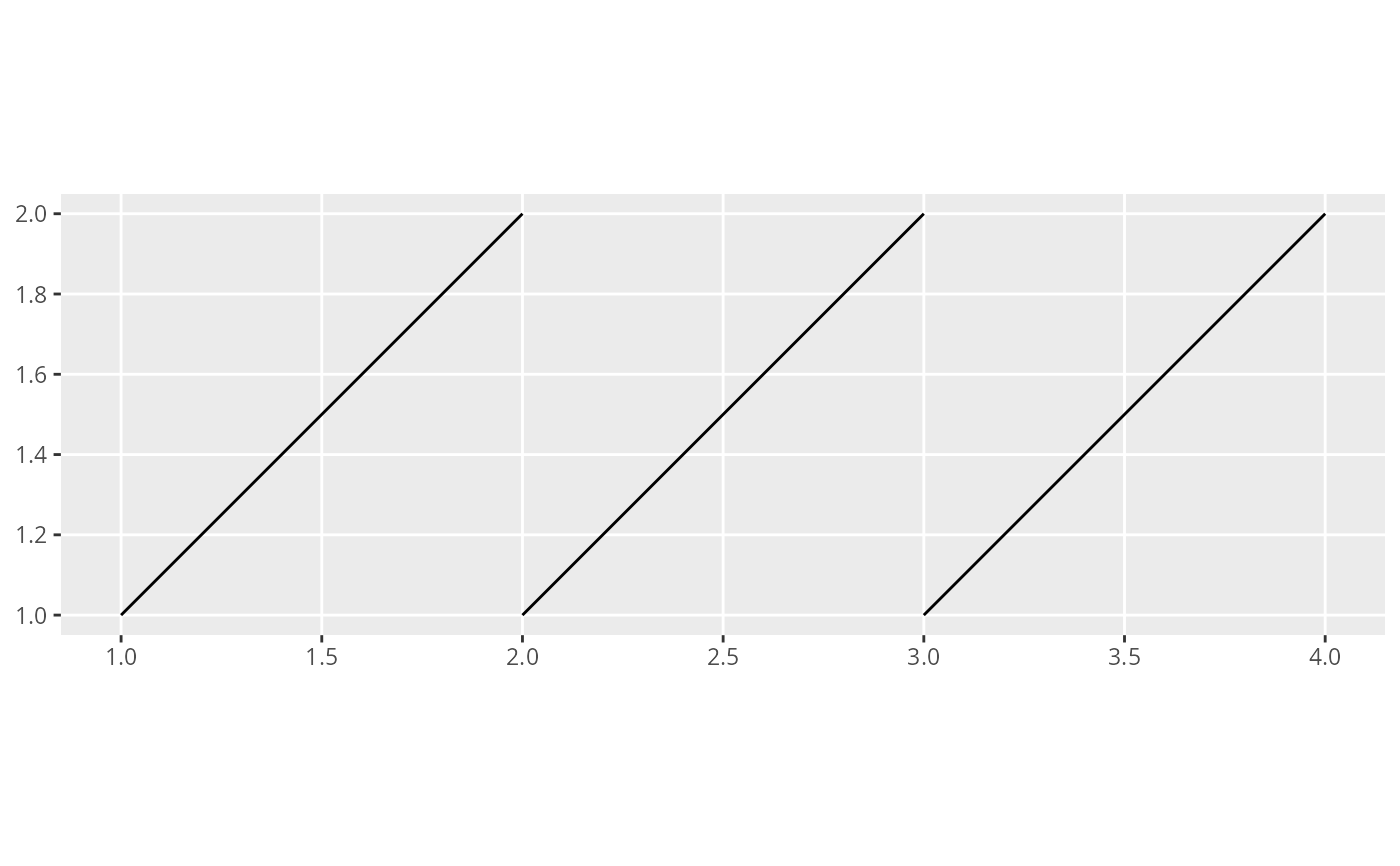
# Create a data frame defining three lines
lns <- data.frame(
xs = c(1, 2, 3), ys = c(1, 1, 1), # start points
xe = c(2, 3, 4), ye = c(2, 2, 2)
) # end points
# Conversion to sf without CRS
spl <- sline(lns,
start.cols = c("xs", "ys"),
end.cols = c("xe", "ye"),
format = "sf"
)
if (require(ggplot2, quietly = TRUE)) {
# Plot the lines
ggplot() +
gg(spl)
}
 # }
# }