Creates a plot sample on a regular grid with a random start location.
Arguments
- spdf
A
SpatialPointsDataFramedefining the points that are to be sampled by the plot sample.- boundary
A
SpatialPolygonsDataFramedefining the survey boundary within which the points occur.- x.ppn
The proportion of the x=axis that is to be included in the plots.
- y.ppn
The proportion of the y=axis that is to be included in the plots.
- nx
The number of plots in the x-dimension.
- ny
The number of plots in the y-dimension.
Value
A list with three components:
plotsA
SpatialPolygonsDataFrameobject containing the plots that were sampled.detsA
SpatialPointsDataFrameobject containing the locations of the points within the plots.countsA
dataframecontaining the following columnsxThe x-coordinates of the centres of the plots within the boundary.
yThe y-coordinates of the centres of the plots within the boundary.
nThe numbers of points in each plot.
areaThe areas of the plots within the boundary
.
Examples
# \donttest{
# Some features require the raster package
if (bru_safe_sp() &&
require("sp") &&
require("raster", quietly = TRUE) &&
require("ggplot2", quietly = TRUE) &&
bru_safe_terra(quietly = TRUE) &&
require("sf", quietly = TRUE)) {
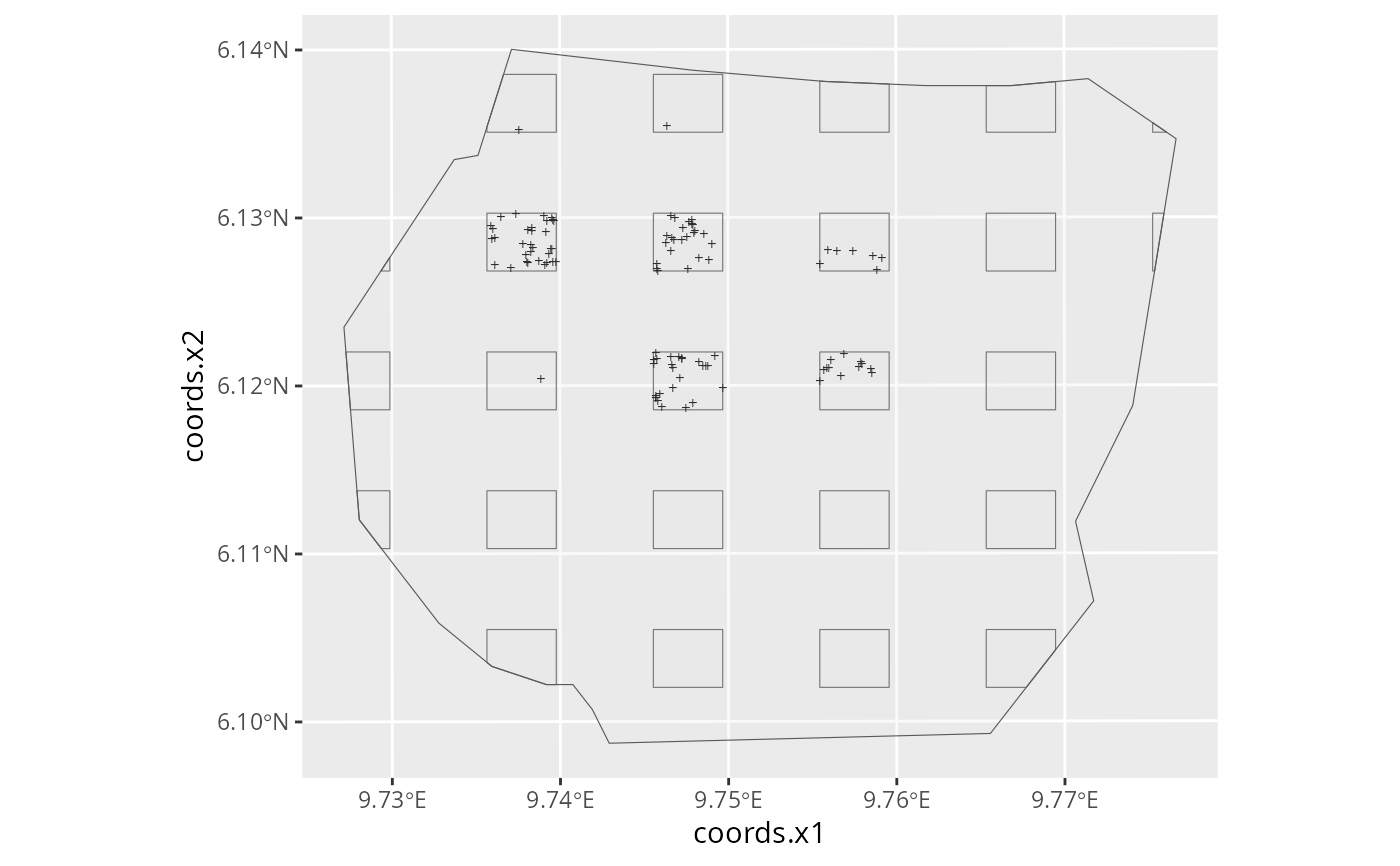
gorillas <- gorillas_sp()
plotpts <- plotsample(gorillas$nests, gorillas$boundary,
x.ppn = 0.4, y.ppn = 0.4, nx = 5, ny = 5
)
ggplot() +
gg(plotpts$plots) +
gg(plotpts$dets, pch = "+", cex = 2) +
gg(gorillas$boundary)
}
#>
#> Attaching package: ‘raster’
#> The following object is masked from ‘package:tidyterra’:
#>
#> select
#> The following object is masked from ‘package:dplyr’:
#>
#> select
 # }
# }