This is the robins_subset dataset, which is a subset of the
full robins data set used to demonstrate a spatially varying trend
coefficient model in Meehan et al. 2019. The dataset includes American
Robin counts, along with time, location, and effort information, from
Audubon Christimas Bird Counts (CBC) conducted in six US states between
1987 and 2016.
Format
The data are a data.frame with variables
circle:Four-letter code of the CBC circle.
bcr:Numeric code for the bird conservation region encompassing the count circle.
state:US state encompassing the count circle.
year:calendar year the count was conducted.
std_yr:transformed year, with 2016 = 0.
count:number of robins recorded.
log_hrs:the natural log of party hours.
lon:longitude of the count circle centroid.
lat:latitude of the count circle centroid.
obs:unique record identifier.
References
Meehan, T.D., Michel, N.L., and Rue, H. 2019. Spatial modeling of Audubon Christmas Bird Counts reveals fine-scale patterns and drivers of relative abundance trends. Ecosphere, 10(4), p.e02707.
Examples
if (require(ggplot2, quietly = TRUE)) {
data(robins_subset, package = "inlabru") # get the data
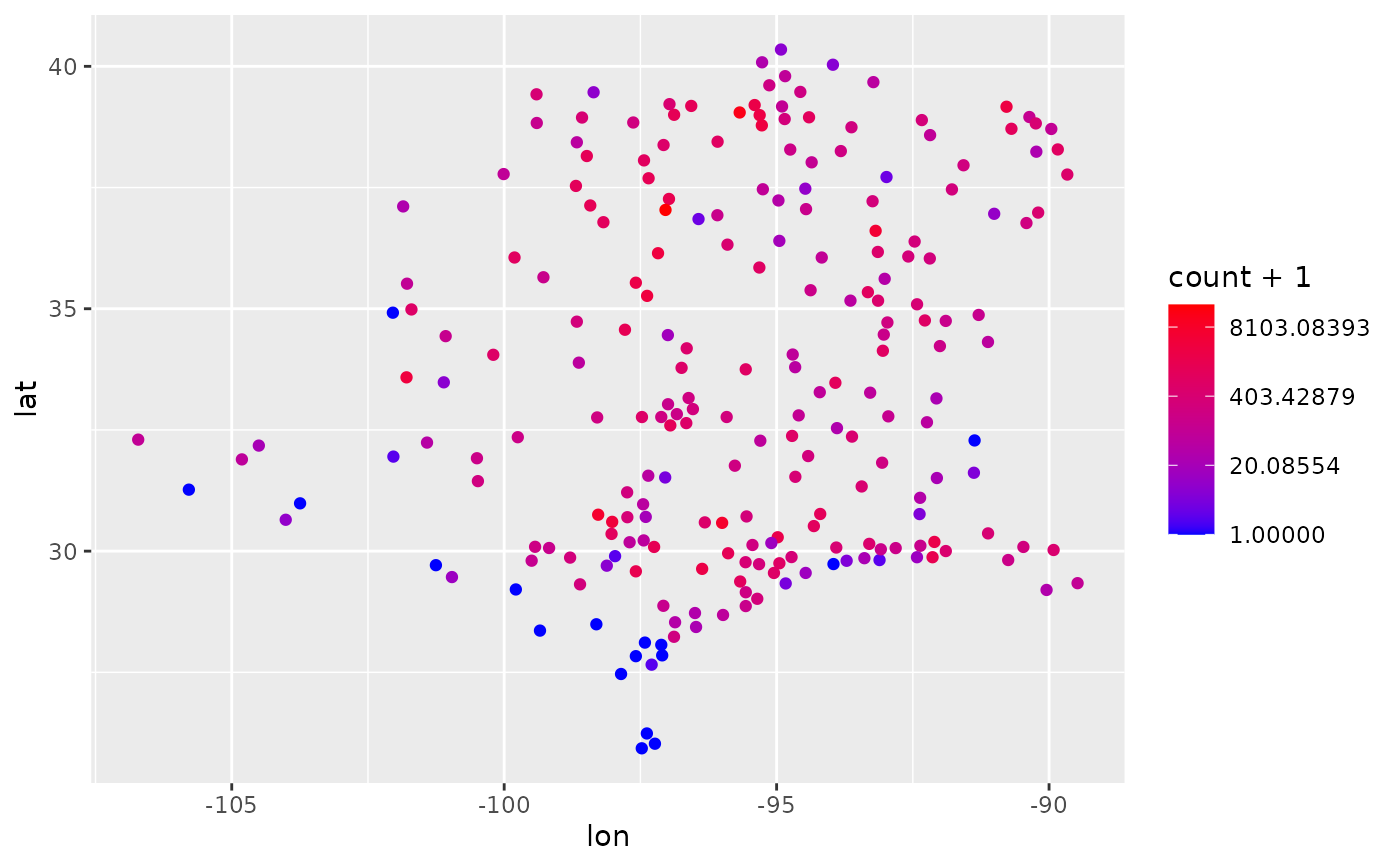
# plot the counts for one year of data
ggplot(robins_subset[robins_subset$std_yr == 0, ]) +
geom_point(aes(lon, lat, colour = count + 1)) +
scale_colour_gradient(low = "blue", high = "red", trans = "log")
}