![[Deprecated]](figures/lifecycle-deprecated.svg) in favour of the
in favour of the patchwork package;
see the example below.
Renders multiple ggplots on a single page.
Arguments
- ...
Comma-separated
ggplotobjects.- plotlist
A list of
ggplotobjects - an alternative to the comma-separated argument above.- cols
Number of columns of plots on the page.
- layout
A matrix specifying the layout. If present,
colsis ignored. If the layout is something likematrix(c(1,2,3,3), nrow=2, byrow=TRUE), then plot 1 will go in the upper left, 2 will go in the upper right, and 3 will go all the way across the bottom.
Author
David L. Borchers dlb@st-andrews.ac.uk
Examples
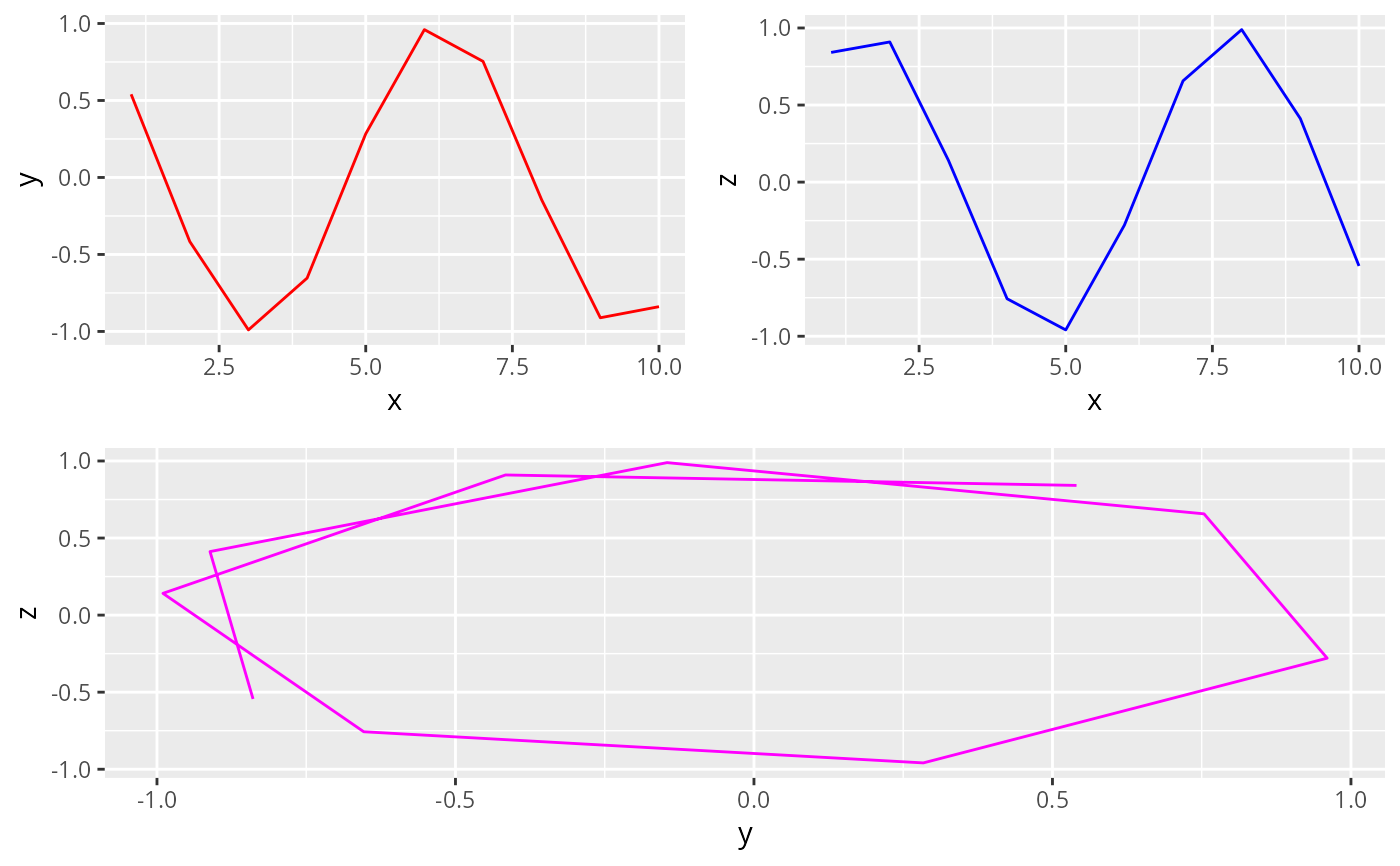
if (require("ggplot2", quietly = TRUE)) {
df <- data.frame(x = 1:10, y = cos(1:10), z = sin(1:10))
pl1 <- ggplot(data = df) +
geom_line(mapping = aes(x, y), color = "red")
pl2 <- ggplot(data = df) +
geom_line(mapping = aes(x, z), color = "blue")
pl3 <- ggplot(data = df) +
geom_path(mapping = aes(y, z), color = "magenta")
multiplot(
pl1, pl2, pl3,
layout = rbind(c(1, 2), c(3, 3))
)
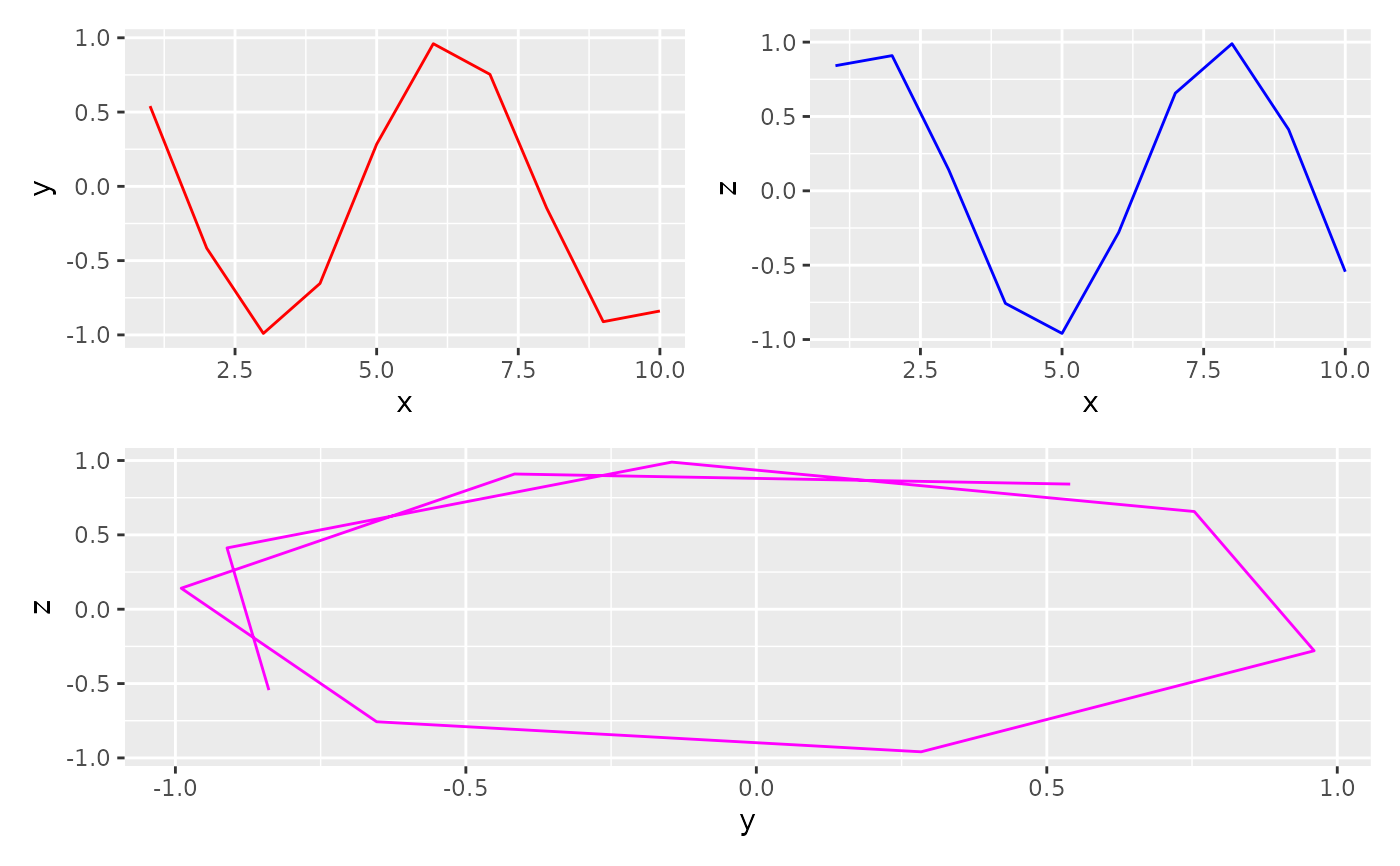
# Recommended alternative using the patchwork package:
if (require("patchwork")) {
(pl1 | pl2) / pl3
}
}
#> Warning: `multiplot()` was deprecated in inlabru 2.13.0.9026.
#> ℹ Please use the 'patchwork' package for combining ggplots.