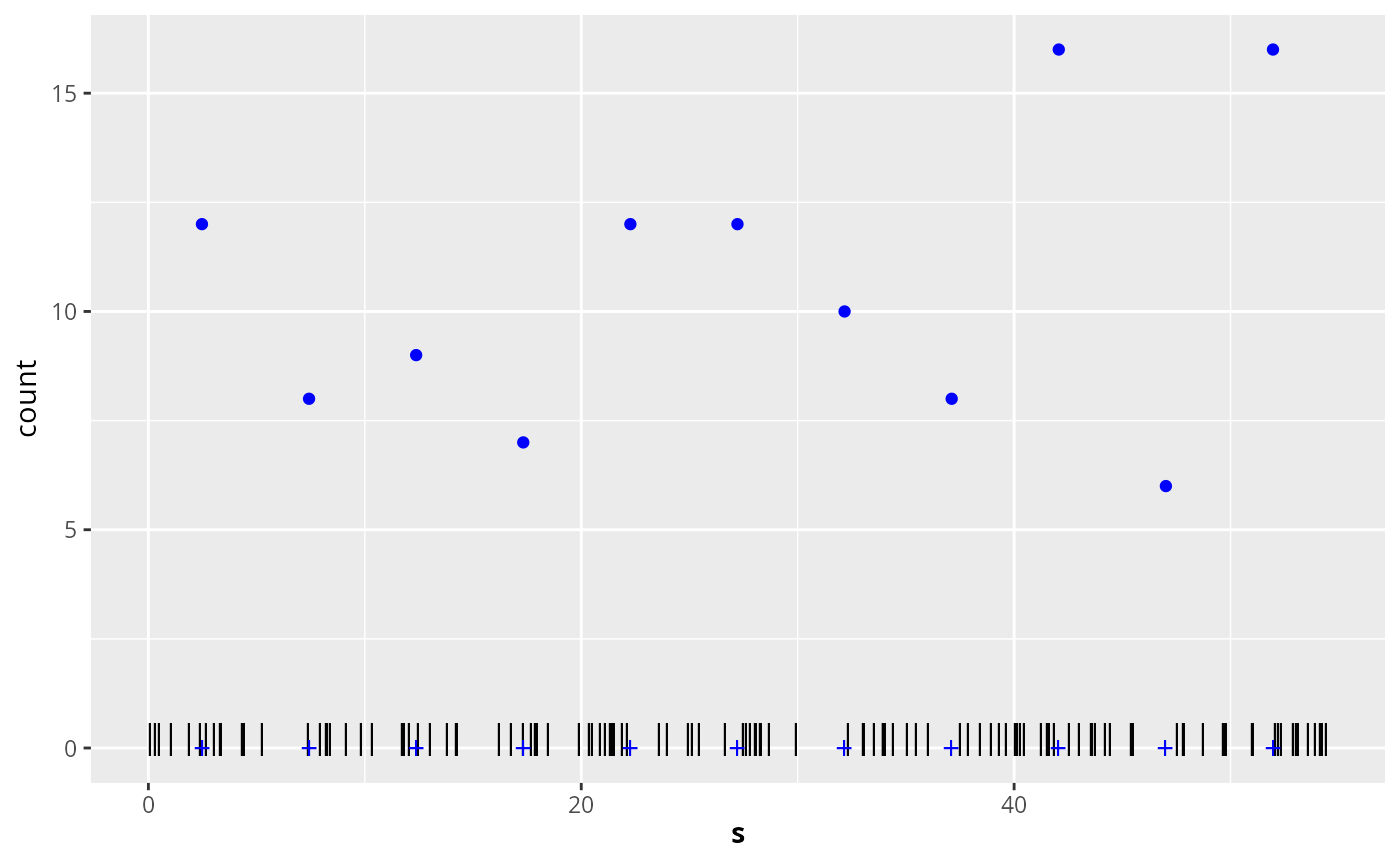
Point data and count data, together with intensity function and expected counts for a homogeneous 1-dimensional Poisson process example.
Usage
data(Poisson1_1D)Format
The data contain the following R objects:
lambda1_1DA function defining the intensity function of a nonhomogeneous Poisson process. Note that this function is only defined on the interval (0,55).
E_nc1The expected counts of the gridded data.
pts1The locations of the observed points (a data frame with one column, named
x).countdata1A data frame with three columns, containing the count data:
Examples
# \donttest{
if (require("ggplot2", quietly = TRUE)) {
  data(Poisson1_1D)
  ggplot(countdata1) +
    geom_point(data = countdata1, aes(x = x, y = count), col = "blue") +
    ylim(0, max(countdata1$count)) +
    geom_point(data = pts1, aes(x = x), y = 0.2, shape = "|", cex = 4) +
    geom_point(
      data = countdata1, aes(x = x), y = 0, shape = "+",
      col = "blue", cex = 4
    ) +
    xlab(expression(bold(s))) +
    ylab("count")
}

# }
# }