![[Experimental]](figures/lifecycle-experimental.svg)
geom_fm is a generic function for generating geomes from various kinds of
fmesher objects, e.g. fm_segm and fm_mesh_2d.
The function invokes particular methods which depend
on the class of the data argument.
Requires the ggplot2 package.
Note: geom_fm is not yet a "proper" ggplot2 geom method; the interface
may therefore change in the future.
Usage
geom_fm(mapping = NULL, data = NULL, ...)

# S3 method for class 'fm_mesh_2d'
geom_fm(
  mapping = NULL,
  data = NULL,
  ...,
  mappings = NULL,
  defs = NULL,
  crs = NULL
)

# S3 method for class 'fm_segm'
geom_fm(mapping = NULL, data = NULL, ..., crs = NULL)

# S3 method for class 'fm_mesh_1d'
geom_fm(
  mapping = NULL,
  data = NULL,
  ...,
  mappings = NULL,
  defs = NULL,
  xlim = NULL,
  basis = TRUE,
  knots = TRUE,
  derivatives = FALSE,
  weights = NULL
)
Arguments
- mapping
ggplot2::aes()mapping information.- data
an object for which to generate a geom.
- ...
Arguments passed on to the geom method.
- mappings, defs
optional lists of
aesmappings and non-aessettings. Forfm_mesh_2d, the non-triangle parts of the mesh, named "int" for interior constraint edges, "bnd" for boundary edges, and "loc" for the vertices. Forfm_mesh_1d, the elements are "knots" and "fun".- crs
Optional crs to transform the object to before plotting.
- xlim
numeric 2-vector; specifies the interval for which to compute functions. Default is
data$interval- basis
logical; if
TRUE(default), show the spline basis functions- knots
logical; if
TRUE(default), show the spline knot locations- derivatives
logical; if
TRUE(not default), draw first order derivatives instead of function values- weights
numeric vector; if provided, draw weighted basis functions and the resulting weighted sum.
Methods (by class)
geom_fm(fm_mesh_2d): Converts anfm_mesh_2d()object tosfwithfm_as_sfc()and usesgeom_sfto visualize the triangles and edges.The mesh vertices are only plotted if
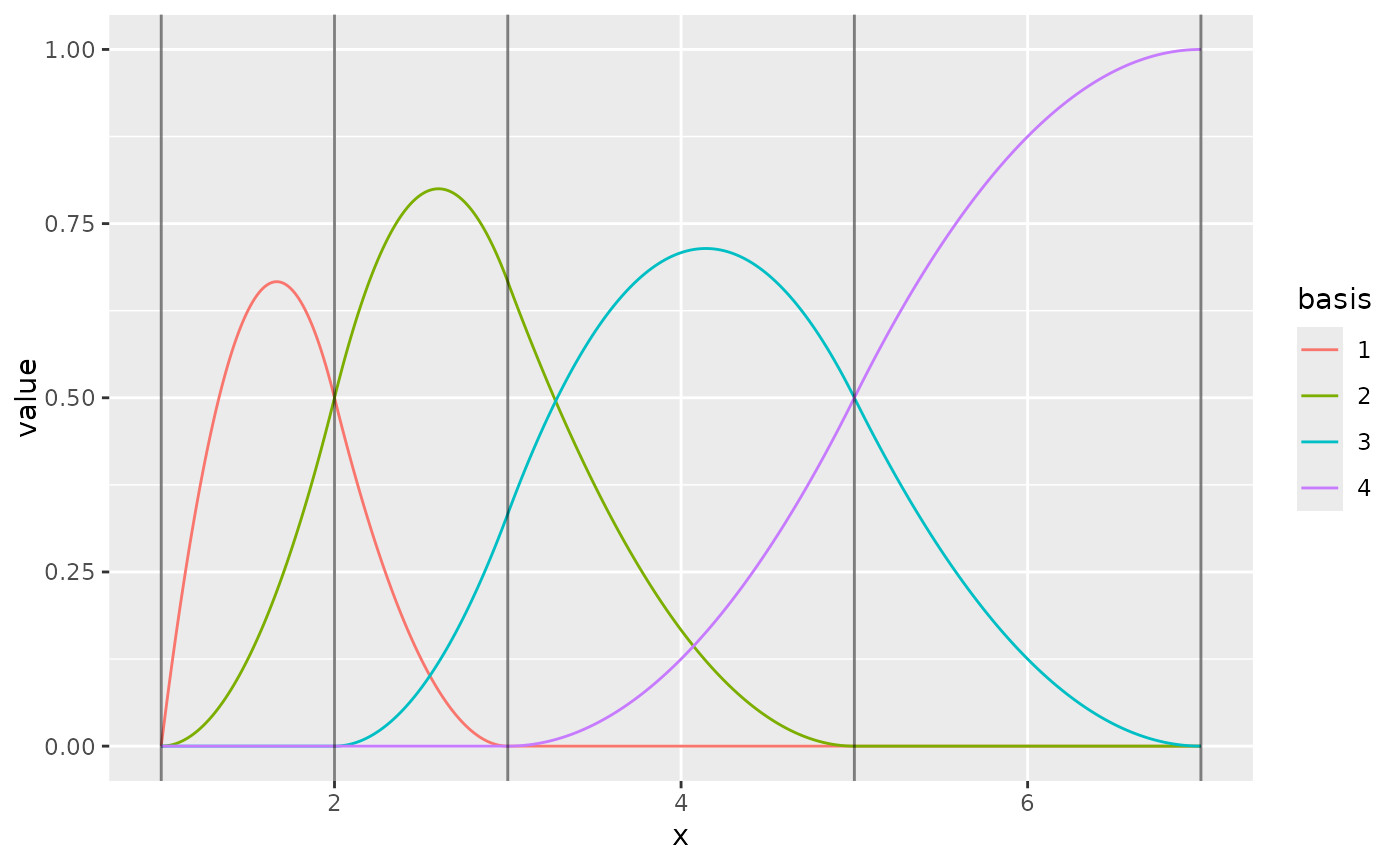
mappings$locordefs$locis non-NULL, e.g.defs = list(loc = list()). Default argument settings:geom_fm(fm_segm): Converts anfm_segm()object tosfwithfm_as_sfc()and usesgeom_sfto visualize it.geom_fm(fm_mesh_1d): Evaluates and plots the basis functions defined by anfm_mesh_1d()object.
Examples
ggplot() +
geom_fm(data = fmexample$mesh)
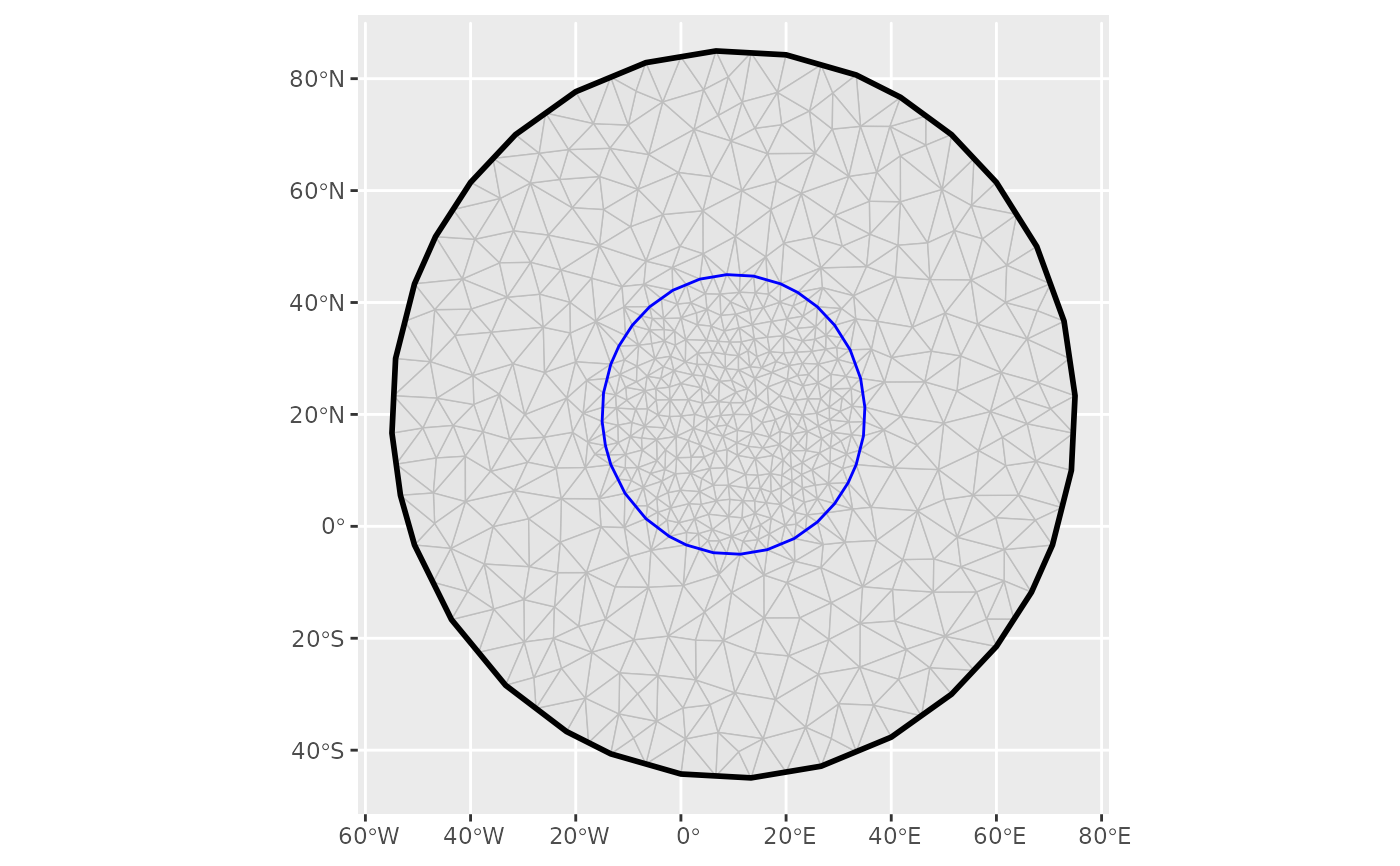
 m <- fm_mesh_2d(
cbind(10, 20),
boundary = fm_extensions(cbind(10, 20), c(25, 65)),
max.edge = c(4, 10),
crs = fm_crs("+proj=longlat")
)
ggplot() +
geom_fm(data = m)
#> st_as_s2(): dropping Z and/or M coordinate
m <- fm_mesh_2d(
cbind(10, 20),
boundary = fm_extensions(cbind(10, 20), c(25, 65)),
max.edge = c(4, 10),
crs = fm_crs("+proj=longlat")
)
ggplot() +
geom_fm(data = m)
#> st_as_s2(): dropping Z and/or M coordinate
 ggplot() +
geom_fm(data = m, defs = list(loc = list()))
#> st_as_s2(): dropping Z and/or M coordinate
ggplot() +
geom_fm(data = m, defs = list(loc = list()))
#> st_as_s2(): dropping Z and/or M coordinate
 ggplot() +
geom_fm(data = m, crs = fm_crs("epsg:27700"))
ggplot() +
geom_fm(data = m, crs = fm_crs("epsg:27700"))
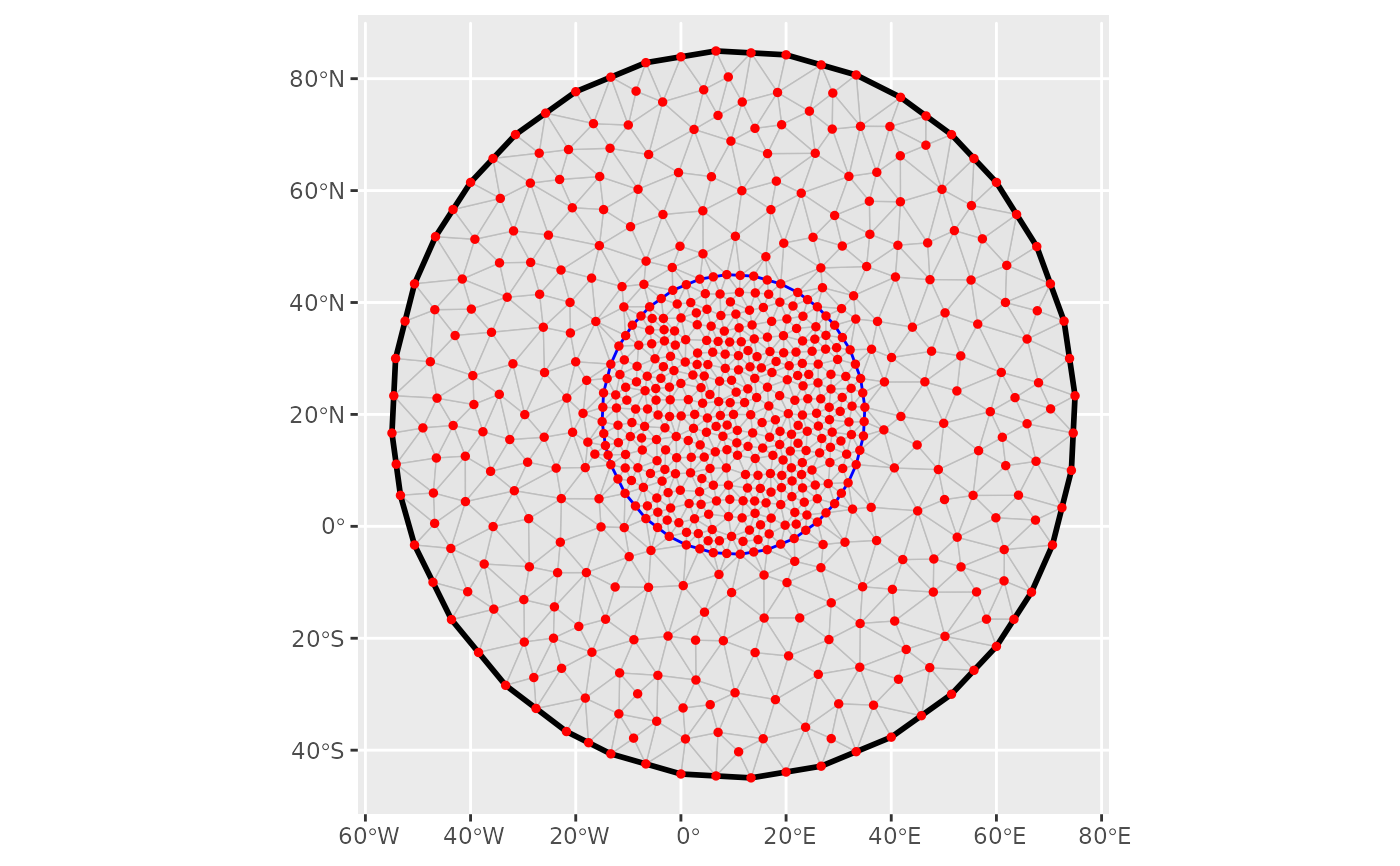
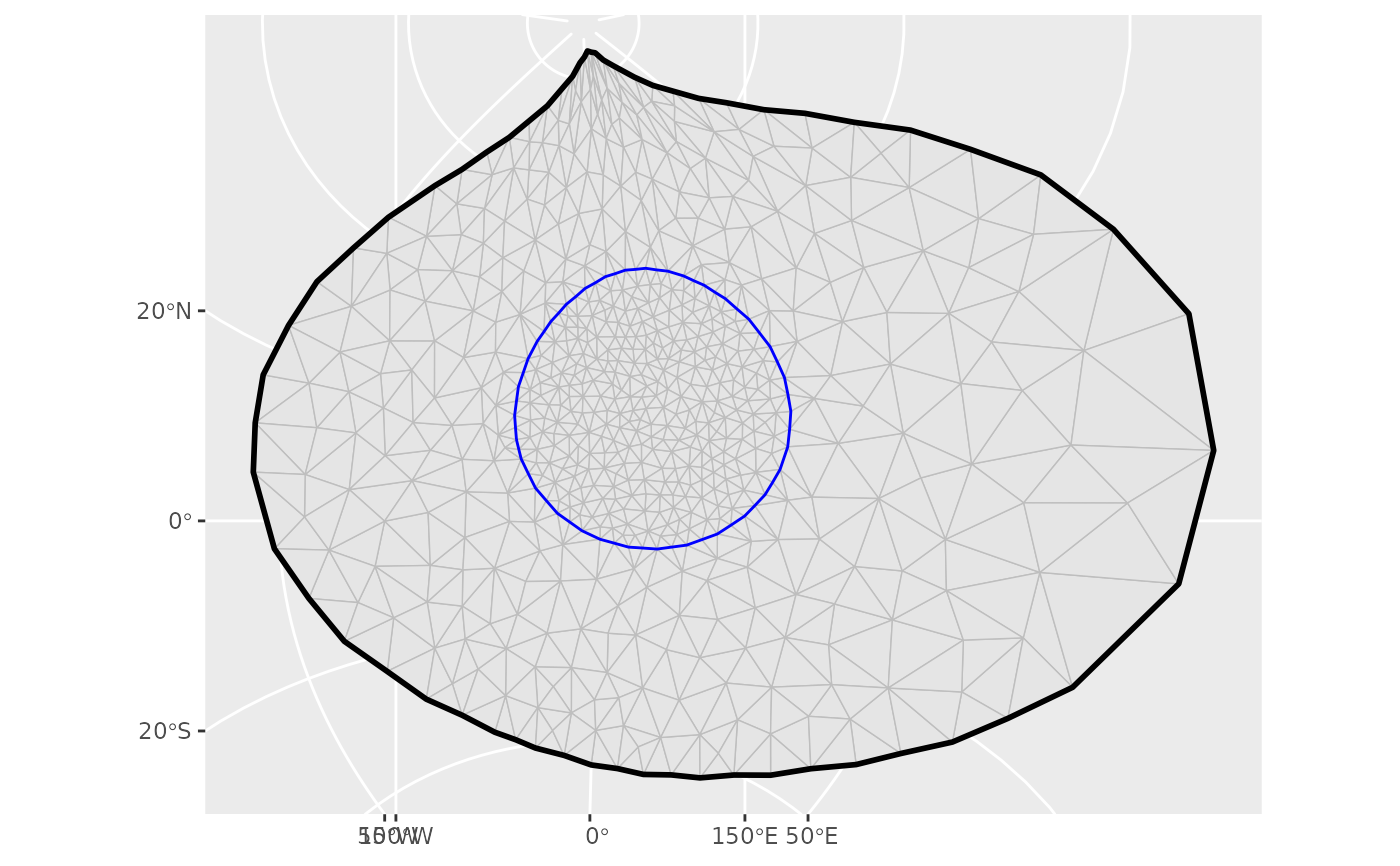 # \donttest{
# Compute a mesh vertex based function on a different grid
px <- fm_pixels(
fm_transform(m, fm_crs("mollweide_globe")),
dims = c(50, 50) # Speed up the example by lowering the resolution
)
px$fun <- fm_evaluate(m,
loc = px,
field = sin(m$loc[, 1] / 5) * sin(m$loc[, 2] / 5)
)
ggplot() +
geom_tile(aes(geometry = geometry, fill = fun),
data = px,
stat = "sf_coordinates"
) +
geom_fm(
data = m, alpha = 0.2, linewidth = 0.05,
crs = fm_crs("mollweide_globe")
)
# \donttest{
# Compute a mesh vertex based function on a different grid
px <- fm_pixels(
fm_transform(m, fm_crs("mollweide_globe")),
dims = c(50, 50) # Speed up the example by lowering the resolution
)
px$fun <- fm_evaluate(m,
loc = px,
field = sin(m$loc[, 1] / 5) * sin(m$loc[, 2] / 5)
)
ggplot() +
geom_tile(aes(geometry = geometry, fill = fun),
data = px,
stat = "sf_coordinates"
) +
geom_fm(
data = m, alpha = 0.2, linewidth = 0.05,
crs = fm_crs("mollweide_globe")
)
 # }
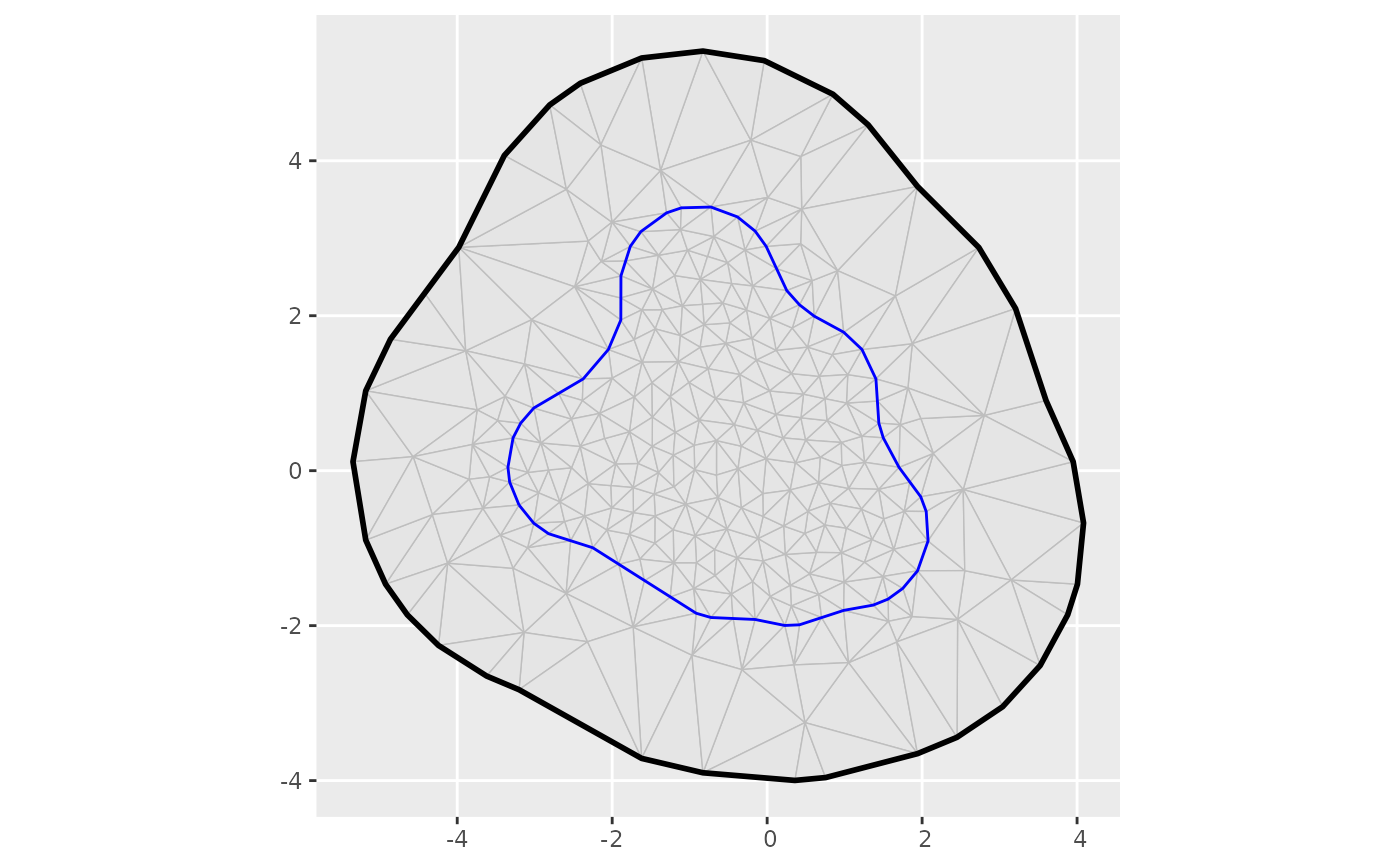
m1 <- fm_segm(rbind(c(1, 2), c(4, 3), c(2, 4)), is.bnd = TRUE)
m2 <- fm_segm(rbind(c(2, 2), c(3, 4), c(2, 3)), is.bnd = FALSE)
ggplot() +
geom_fm(data = m1) +
geom_fm(data = m2)
# }
m1 <- fm_segm(rbind(c(1, 2), c(4, 3), c(2, 4)), is.bnd = TRUE)
m2 <- fm_segm(rbind(c(2, 2), c(3, 4), c(2, 3)), is.bnd = FALSE)
ggplot() +
geom_fm(data = m1) +
geom_fm(data = m2)
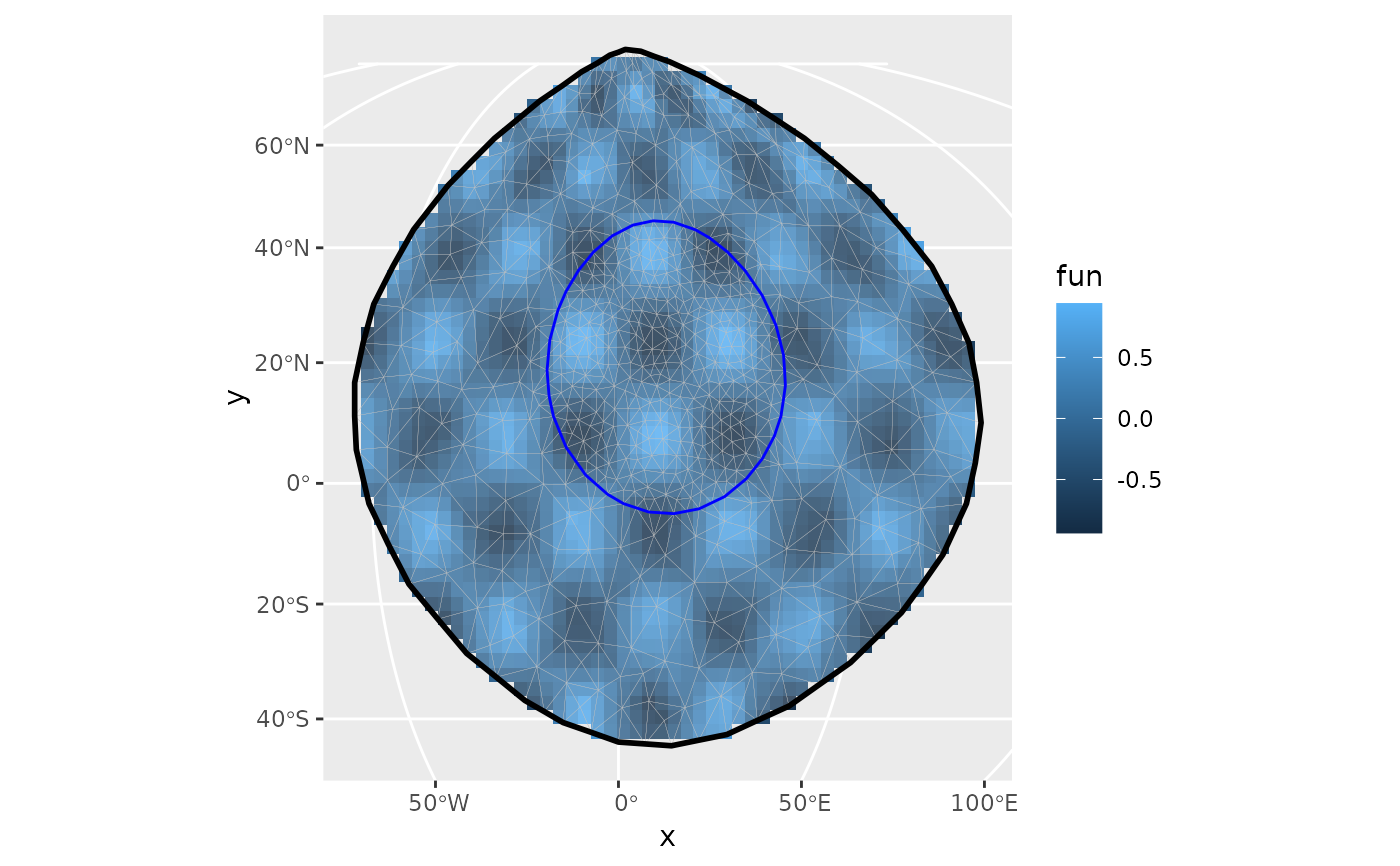
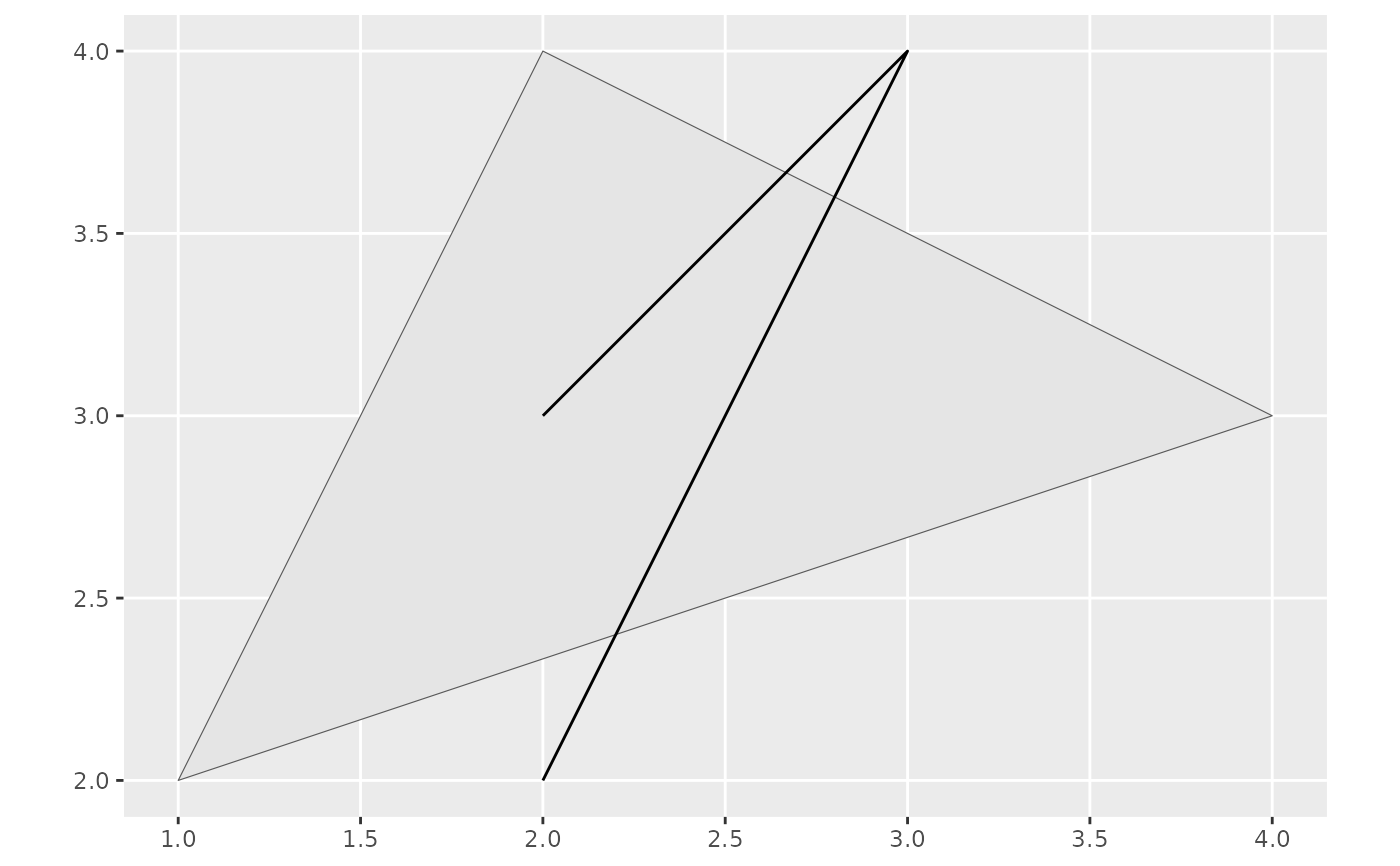 m <- fm_mesh_1d(
c(1, 2, 3, 5, 7),
boundary = c("dirichlet", "neumann"),
degree = 2
)
ggplot() +
geom_fm(data = m)
m <- fm_mesh_1d(
c(1, 2, 3, 5, 7),
boundary = c("dirichlet", "neumann"),
degree = 2
)
ggplot() +
geom_fm(data = m)