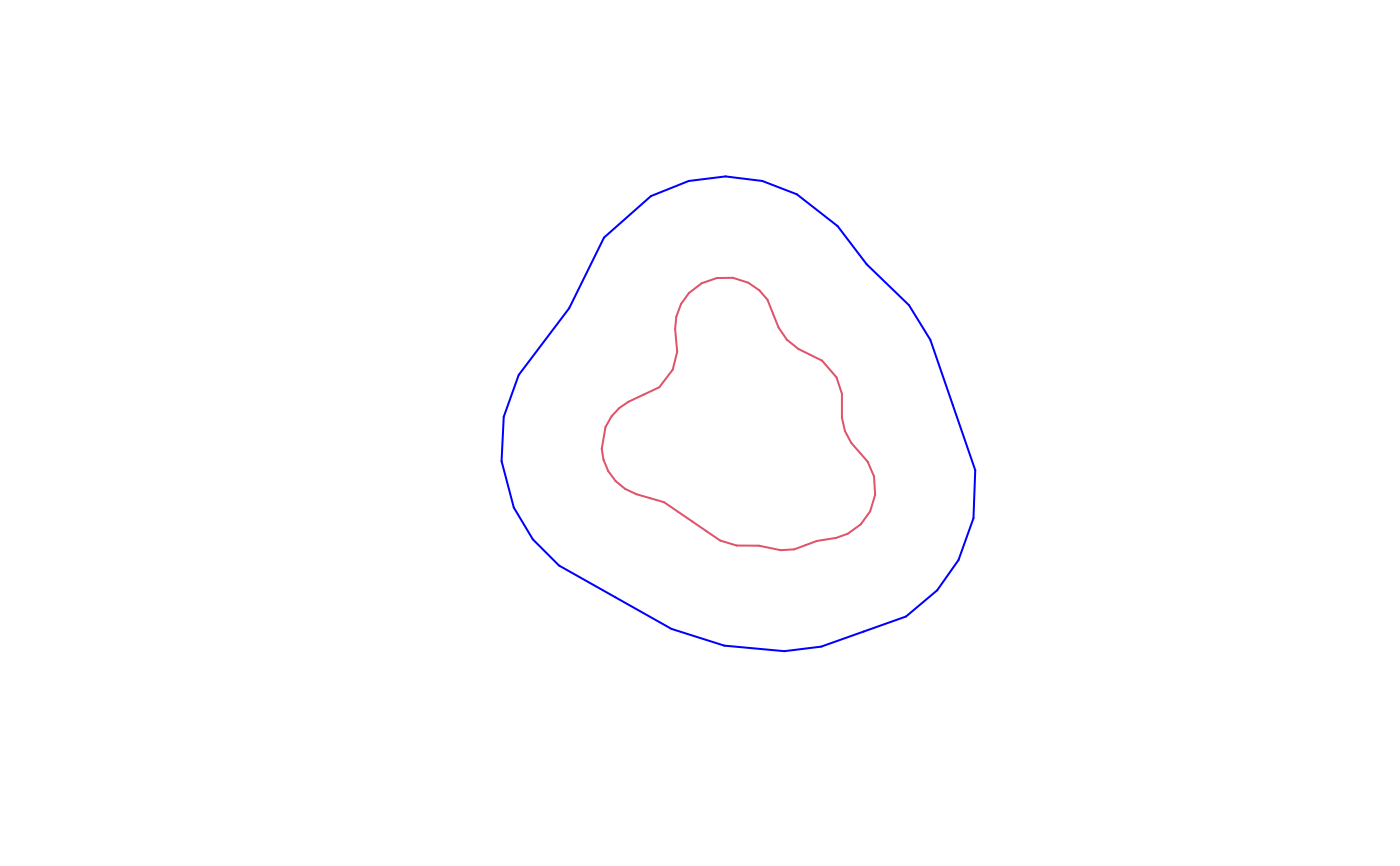
Draws a fm_segm() object with generic or rgl
graphics.
Usage
# S3 method for class 'fm_segm'
plot(x, ..., add = FALSE)

# S3 method for class 'fm_segm'
lines(
  x,
  loc = NULL,
  col = NULL,
  colors = c("black", "blue", "red", "green"),
  add = TRUE,
  xlim = NULL,
  ylim = NULL,
  asp = 1,
  axes = FALSE,
  xlab = "",
  ylab = "",
  visibility = "front",
  rgl = deprecated(),
  ...
)

# S3 method for class 'fm_segm_list'
plot(x, ...)

# S3 method for class 'fm_segm_list'
lines(x, ...)
Arguments
- x
An
fm_segm()object.- ...
Additional parameters, passed on to graphics methods.
- add
If
TRUE, add to the current plot, otherwise start a new plot.- loc
Point locations to be used if
x$locisNULL.- col
Segment color specification.
- colors
Colors to cycle through if
colisNULL.- xlim, ylim
X and Y axis limits for a new plot.
- asp
Aspect ratio for new plots. Default 1.
- axes
logical; whether axes should be drawn on the plot. Default FALSE.
- xlab, ylab
character; labels for the axes.
- visibility
If "front" only display mesh faces with normal pointing towards the camera.
- rgl
![[Deprecated]](figures/lifecycle-deprecated.svg) since
since 0.5.0.9000in favour of theplot_rgl()andlines_rgl()methods. IfTRUE, userglfor plotting.
Author
Finn Lindgren Finn.Lindgren@gmail.com