![[Experimental]](figures/lifecycle-experimental.svg) Simplifies polygonal curve segments by joining nearly
co-linear segments.
Simplifies polygonal curve segments by joining nearly
co-linear segments.
Uses a variation of the binary splitting Ramer-Douglas-Peucker algorithm,
with an ellipse of half-width eps ellipse instead of a rectangle, motivated
by prediction ellipse for Brownian bridge.
Arguments
- x
An
fm_segm()object.- eps
Absolute straightness tolerance. Default
NULL, no constraint.- eps_rel
Relative straightness tolerance. Default
NULL, no constraint.- ...
Currently unused.
Value
The simplified fm_segm() object.
Details
Variation of Ramer-Douglas-Peucker. Uses width epsilon ellipse instead of rectangle, motivated by prediction ellipse for Brownian bridge.
References
Ramer, Urs (1972). "An iterative procedure for the polygonal approximation of plane curves". Computer Graphics and Image Processing. 1 (3): 244–256. doi:10.1016/S0146-664X(72)80017-0
Douglas, David; Peucker, Thomas (1973). "Algorithms for the reduction of the number of points required to represent a digitized line or its caricature". The Canadian Cartographer. 10 (2): 112–122. doi:10.3138/FM57-6770-U75U-7727
See also
Other object creation and conversion:
fm_as_collect(),
fm_as_fm(),
fm_as_lattice_2d(),
fm_as_lattice_Nd(),
fm_as_mesh_1d(),
fm_as_mesh_2d(),
fm_as_mesh_3d(),
fm_as_segm(),
fm_as_sfc(),
fm_as_tensor(),
fm_collect(),
fm_lattice_2d(),
fm_lattice_Nd(),
fm_mesh_1d(),
fm_mesh_2d(),
fm_segm(),
fm_tensor()
Author
Finn Lindgren Finn.Lindgren@gmail.com
Examples
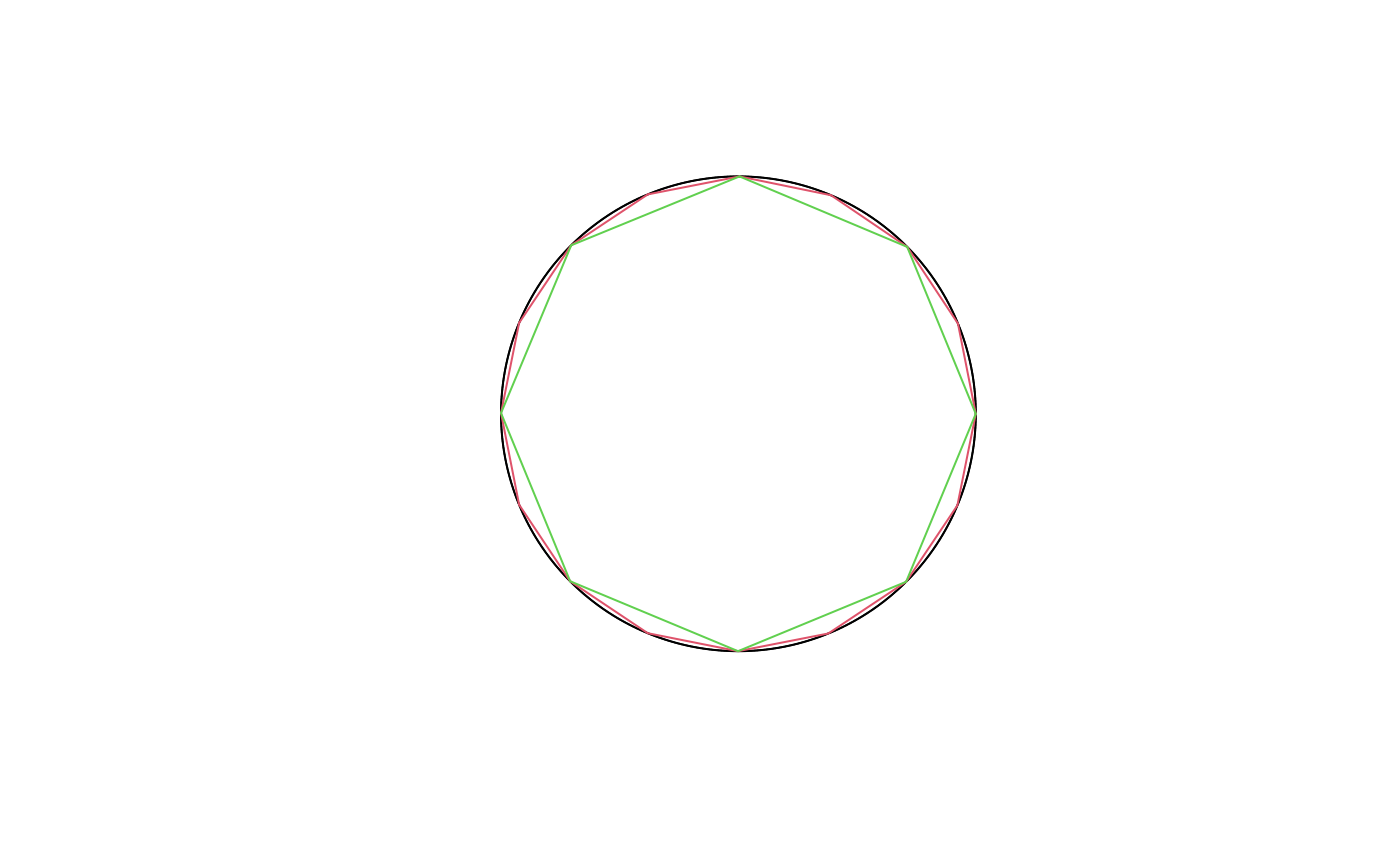
theta <- seq(0, 2 * pi, length.out = 1000)
(segm <- fm_segm(cbind(cos(theta), sin(theta)),
idx = seq_along(theta)
))
#> fm_segm object:
#> 999 boundary edges
#> Bounding box = (-0.9999951, 1.0000000) x (-0.9999988, 0.9999988) x (0,0)
(segm1 <- fm_simplify(segm, eps_rel = 0.1))
#> fm_segm object:
#> 16 boundary edges (1 group: 0)
#> Bounding box = (-0.9999951, 1.0000000) x (-0.9999988, 0.9999889) x (0,0)
(segm2 <- fm_simplify(segm, eps_rel = 0.2))
#> fm_segm object:
#> 8 boundary edges (1 group: 0)
#> Bounding box = (-0.9999951, 1.0000000) x (-0.9999988, 0.9999889) x (0,0)
plot(segm)
lines(segm1, col = 2)
lines(segm2, col = 3)
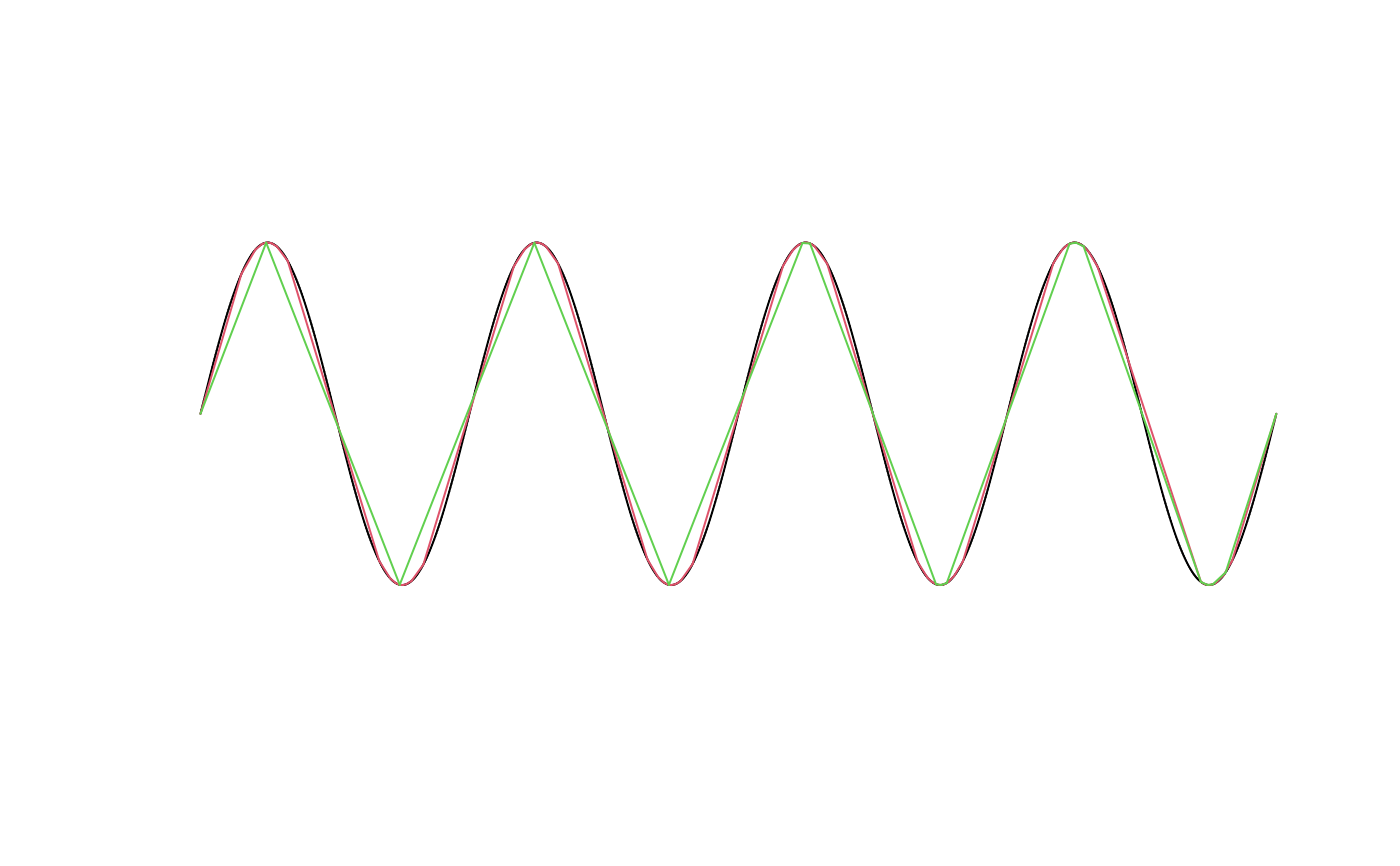
 (segm <- fm_segm(cbind(theta, sin(theta * 4)),
idx = seq_along(theta)
))
#> fm_segm object:
#> 999 boundary edges
#> Bounding box = (0.000000,6.283185) x (-0.9999988, 0.9999988) x (0,0)
(segm1 <- fm_simplify(segm, eps_rel = 0.1))
#> fm_segm object:
#> 73 boundary edges (1 group: 0)
#> Bounding box = (0.000000,6.283185) x (-0.9999988, 0.9999988) x (0,0)
(segm2 <- fm_simplify(segm, eps_rel = 0.2))
#> fm_segm object:
#> 17 boundary edges (1 group: 0)
#> Bounding box = (0.000000,6.283185) x (-0.9995538, 0.9994549) x (0,0)
plot(segm)
lines(segm1, col = 2)
lines(segm2, col = 3)
(segm <- fm_segm(cbind(theta, sin(theta * 4)),
idx = seq_along(theta)
))
#> fm_segm object:
#> 999 boundary edges
#> Bounding box = (0.000000,6.283185) x (-0.9999988, 0.9999988) x (0,0)
(segm1 <- fm_simplify(segm, eps_rel = 0.1))
#> fm_segm object:
#> 73 boundary edges (1 group: 0)
#> Bounding box = (0.000000,6.283185) x (-0.9999988, 0.9999988) x (0,0)
(segm2 <- fm_simplify(segm, eps_rel = 0.2))
#> fm_segm object:
#> 17 boundary edges (1 group: 0)
#> Bounding box = (0.000000,6.283185) x (-0.9995538, 0.9994549) x (0,0)
plot(segm)
lines(segm1, col = 2)
lines(segm2, col = 3)