Extracts the vertices of a mesh object.
Usage
fm_vertices(x, format = NULL, name = NULL, ...)

# S3 method for class 'fm_mesh_2d'
fm_vertices(x, format = NULL, name = NULL, ...)

# S3 method for class 'fm_mesh_3d'
fm_vertices(x, format = NULL, name = NULL, ...)

# S3 method for class 'fm_collect'
fm_vertices(x, format = NULL, name = NULL, ...)Value
An sf, data.frame, or SpatialPointsDataFrame object, with the vertex
coordinates, and a .vertex column with the vertex indices.
Methods (by class)
fm_vertices(fm_collect): The result is augmented with a column ".index" with the index of the mesh in the fm_collectobject.
Author
Finn Lindgren Finn.Lindgren@gmail.com
Examples
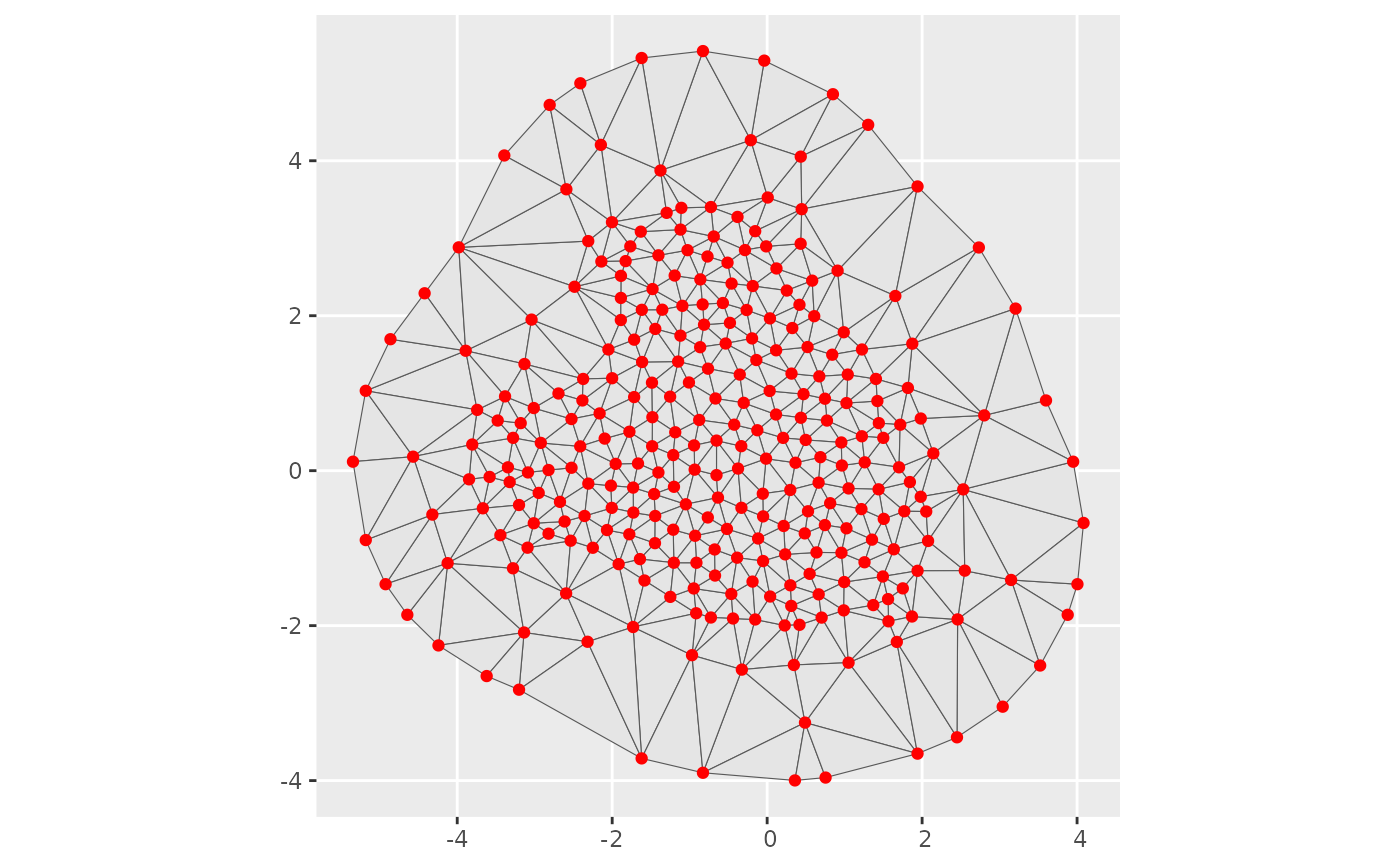
if (require("ggplot2", quietly = TRUE)) {
vrt <- fm_vertices(fmexample$mesh, format = "sf")
ggplot() +
geom_sf(data = fm_as_sfc(fmexample$mesh)) +
geom_sf(data = vrt, color = "red")
}
 vrt <- fm_vertices(
fm_collect(list(fmexample$mesh, fmexample$mesh)),
format = "sf",
name = "xyzzy"
)
vrt
#> Simple feature collection with 584 features and 2 fields
#> Geometry type: POINT
#> Dimension: XYZ
#> Bounding box: xmin: -5.345477 ymin: -3.997839 xmax: 4.08358 ymax: 5.415519
#> z_range: zmin: 0 zmax: 0
#> CRS: NA
#> # A tibble: 584 × 3
#> xyzzy.vertex xyzzy.index[,1] xyzzy
#> * <int> <int> <POINT>
#> 1 1 1 Z (-5.180541 -0.8956538 0)
#> 2 2 1 Z (-4.924679 -1.465076 0)
#> 3 3 1 Z (-4.644074 -1.860313 0)
#> 4 4 1 Z (-4.242024 -2.255549 0)
#> 5 5 1 Z (-3.620028 -2.650785 0)
#> 6 6 1 Z (-3.202318 -2.82668 0)
#> 7 7 1 Z (-1.61974 -3.713512 0)
#> 8 8 1 Z (-0.8284506 -3.89906 0)
#> 9 9 1 Z (0.3584832 -3.997839 0)
#> 10 10 1 Z (0.7541278 -3.960901 0)
#> # ℹ 574 more rows
vrt <- fm_vertices(
fm_collect(list(fmexample$mesh, fmexample$mesh)),
format = "sf",
name = "xyzzy"
)
vrt
#> Simple feature collection with 584 features and 2 fields
#> Geometry type: POINT
#> Dimension: XYZ
#> Bounding box: xmin: -5.345477 ymin: -3.997839 xmax: 4.08358 ymax: 5.415519
#> z_range: zmin: 0 zmax: 0
#> CRS: NA
#> # A tibble: 584 × 3
#> xyzzy.vertex xyzzy.index[,1] xyzzy
#> * <int> <int> <POINT>
#> 1 1 1 Z (-5.180541 -0.8956538 0)
#> 2 2 1 Z (-4.924679 -1.465076 0)
#> 3 3 1 Z (-4.644074 -1.860313 0)
#> 4 4 1 Z (-4.242024 -2.255549 0)
#> 5 5 1 Z (-3.620028 -2.650785 0)
#> 6 6 1 Z (-3.202318 -2.82668 0)
#> 7 7 1 Z (-1.61974 -3.713512 0)
#> 8 8 1 Z (-0.8284506 -3.89906 0)
#> 9 9 1 Z (0.3584832 -3.997839 0)
#> 10 10 1 Z (0.7541278 -3.960901 0)
#> # ℹ 574 more rows